
Bidirectional Modulation of the Voltage-Gated Sodium (Nav1.6) Channel by Rationally Designed Peptidomimetics

 , , , and
Abstract
:
1. Introduction
2. Results
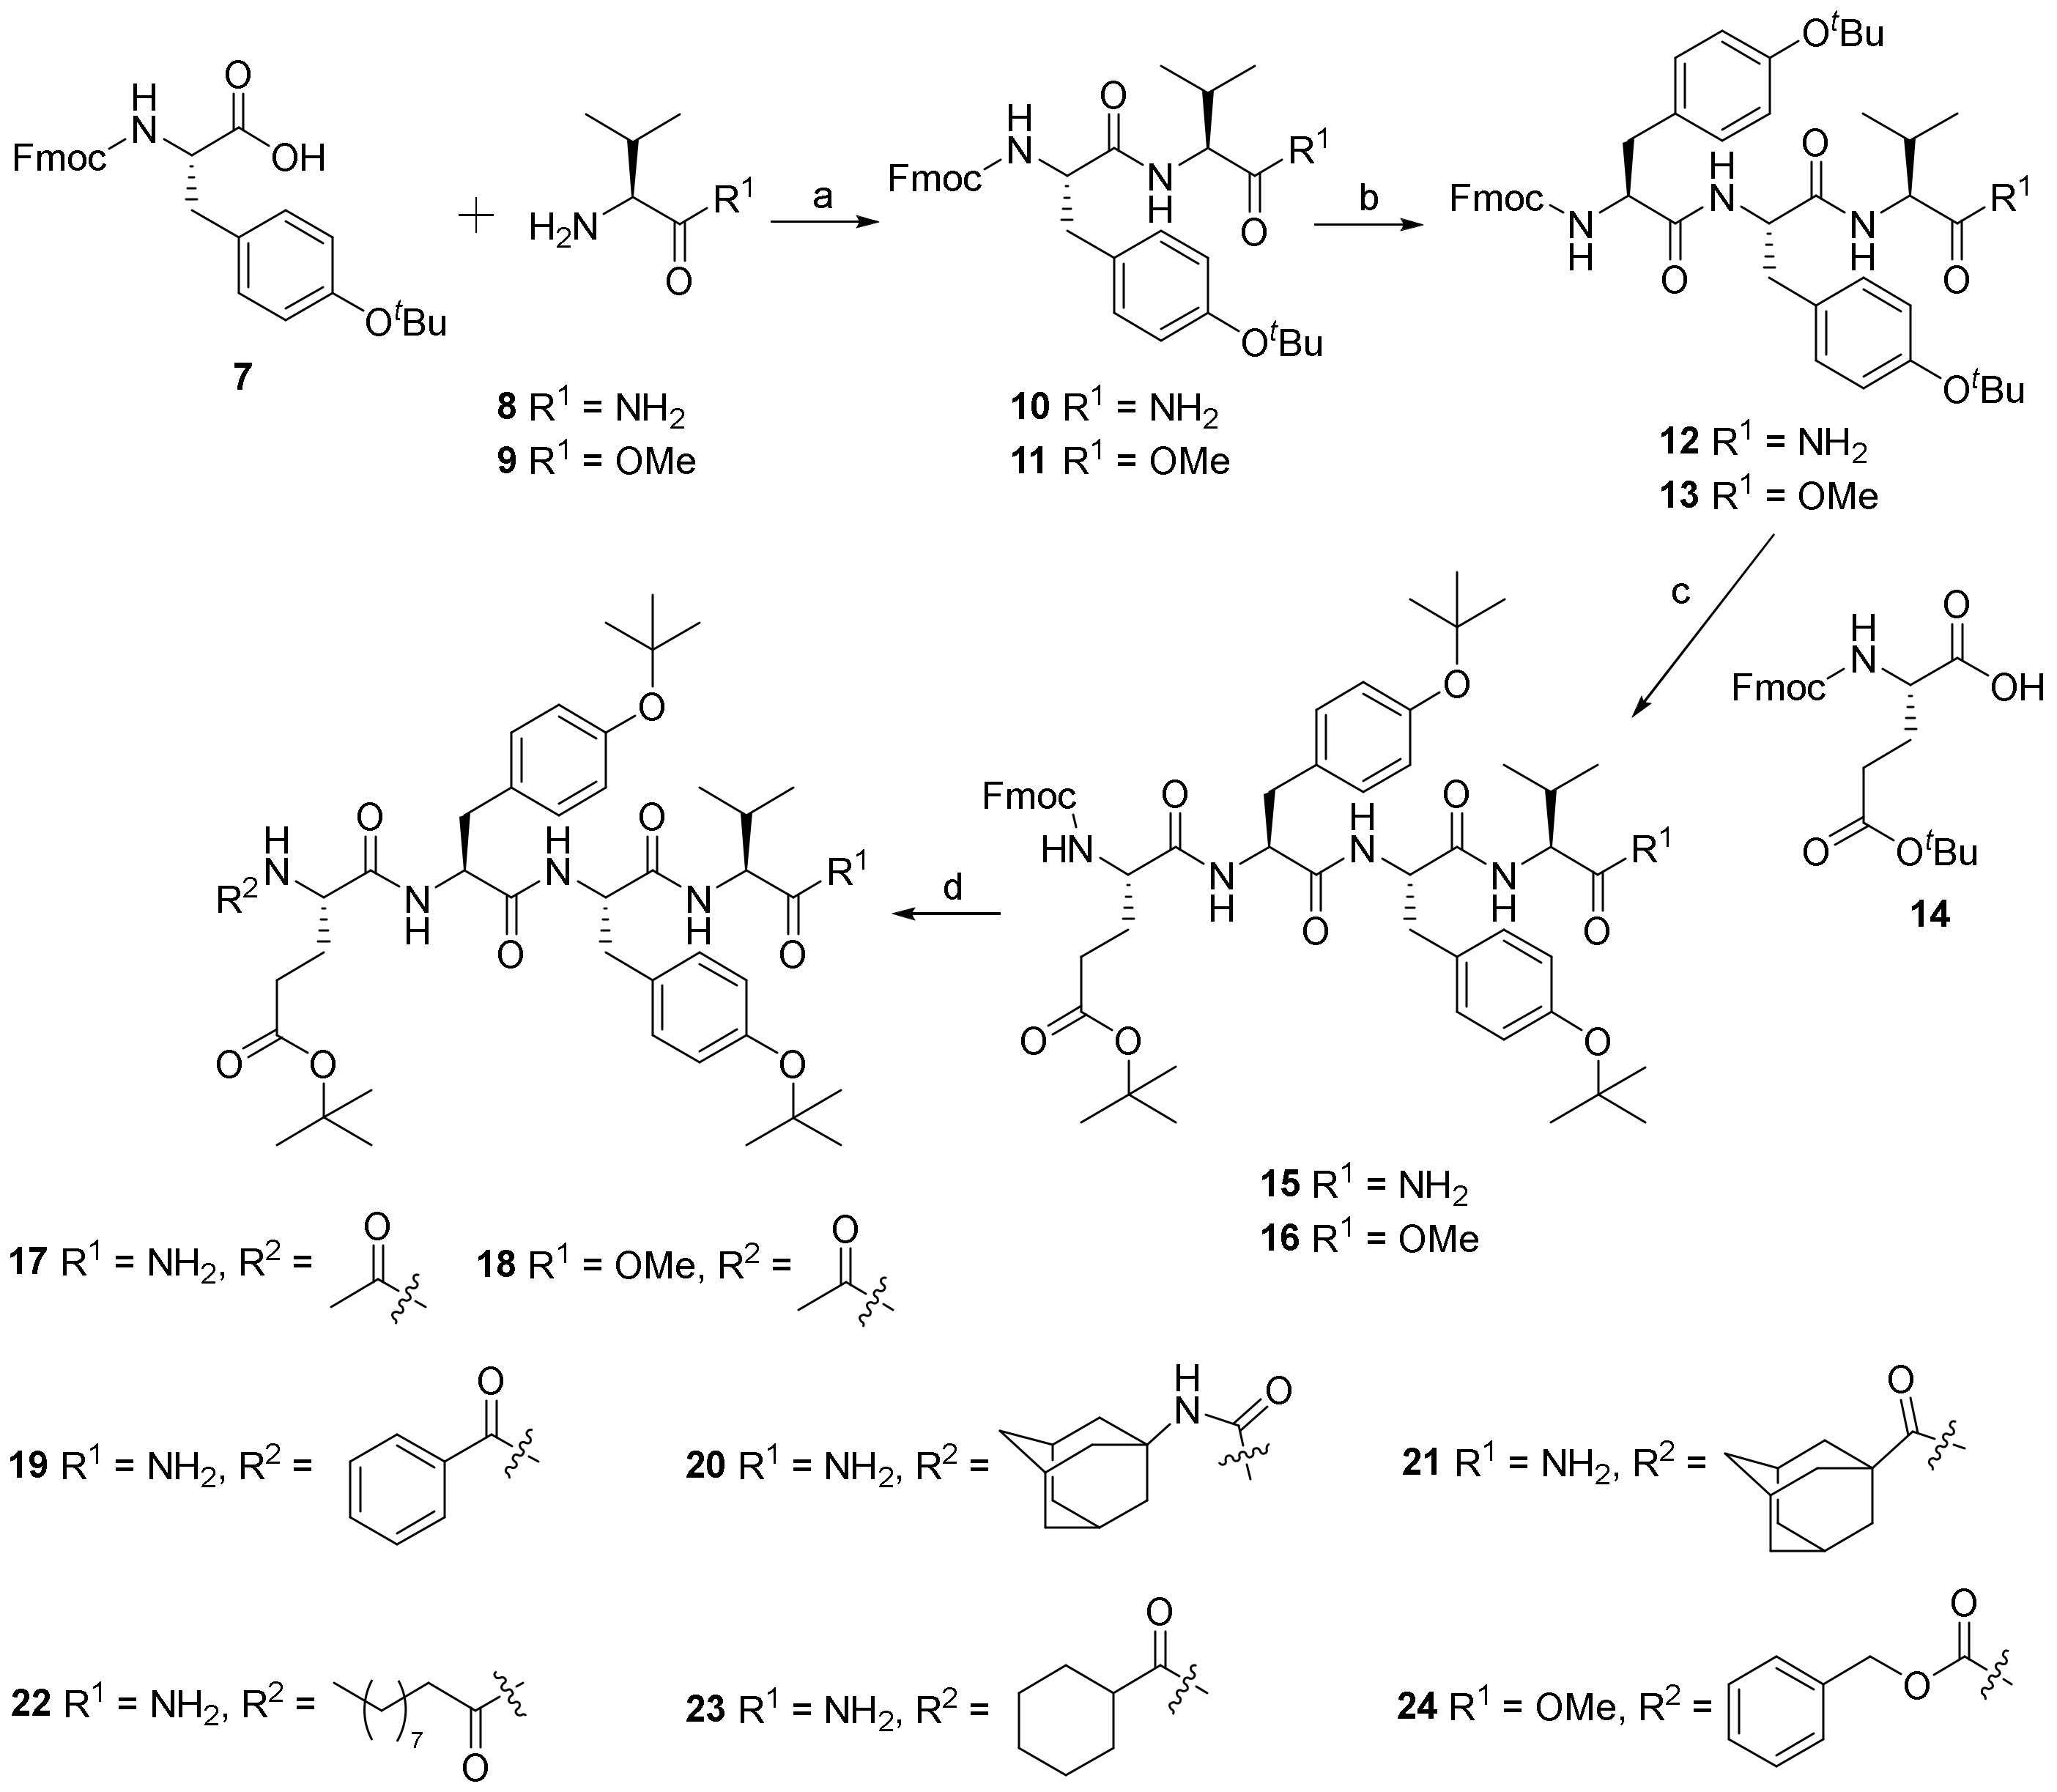
2.1. Chemistry
2.2. Biology
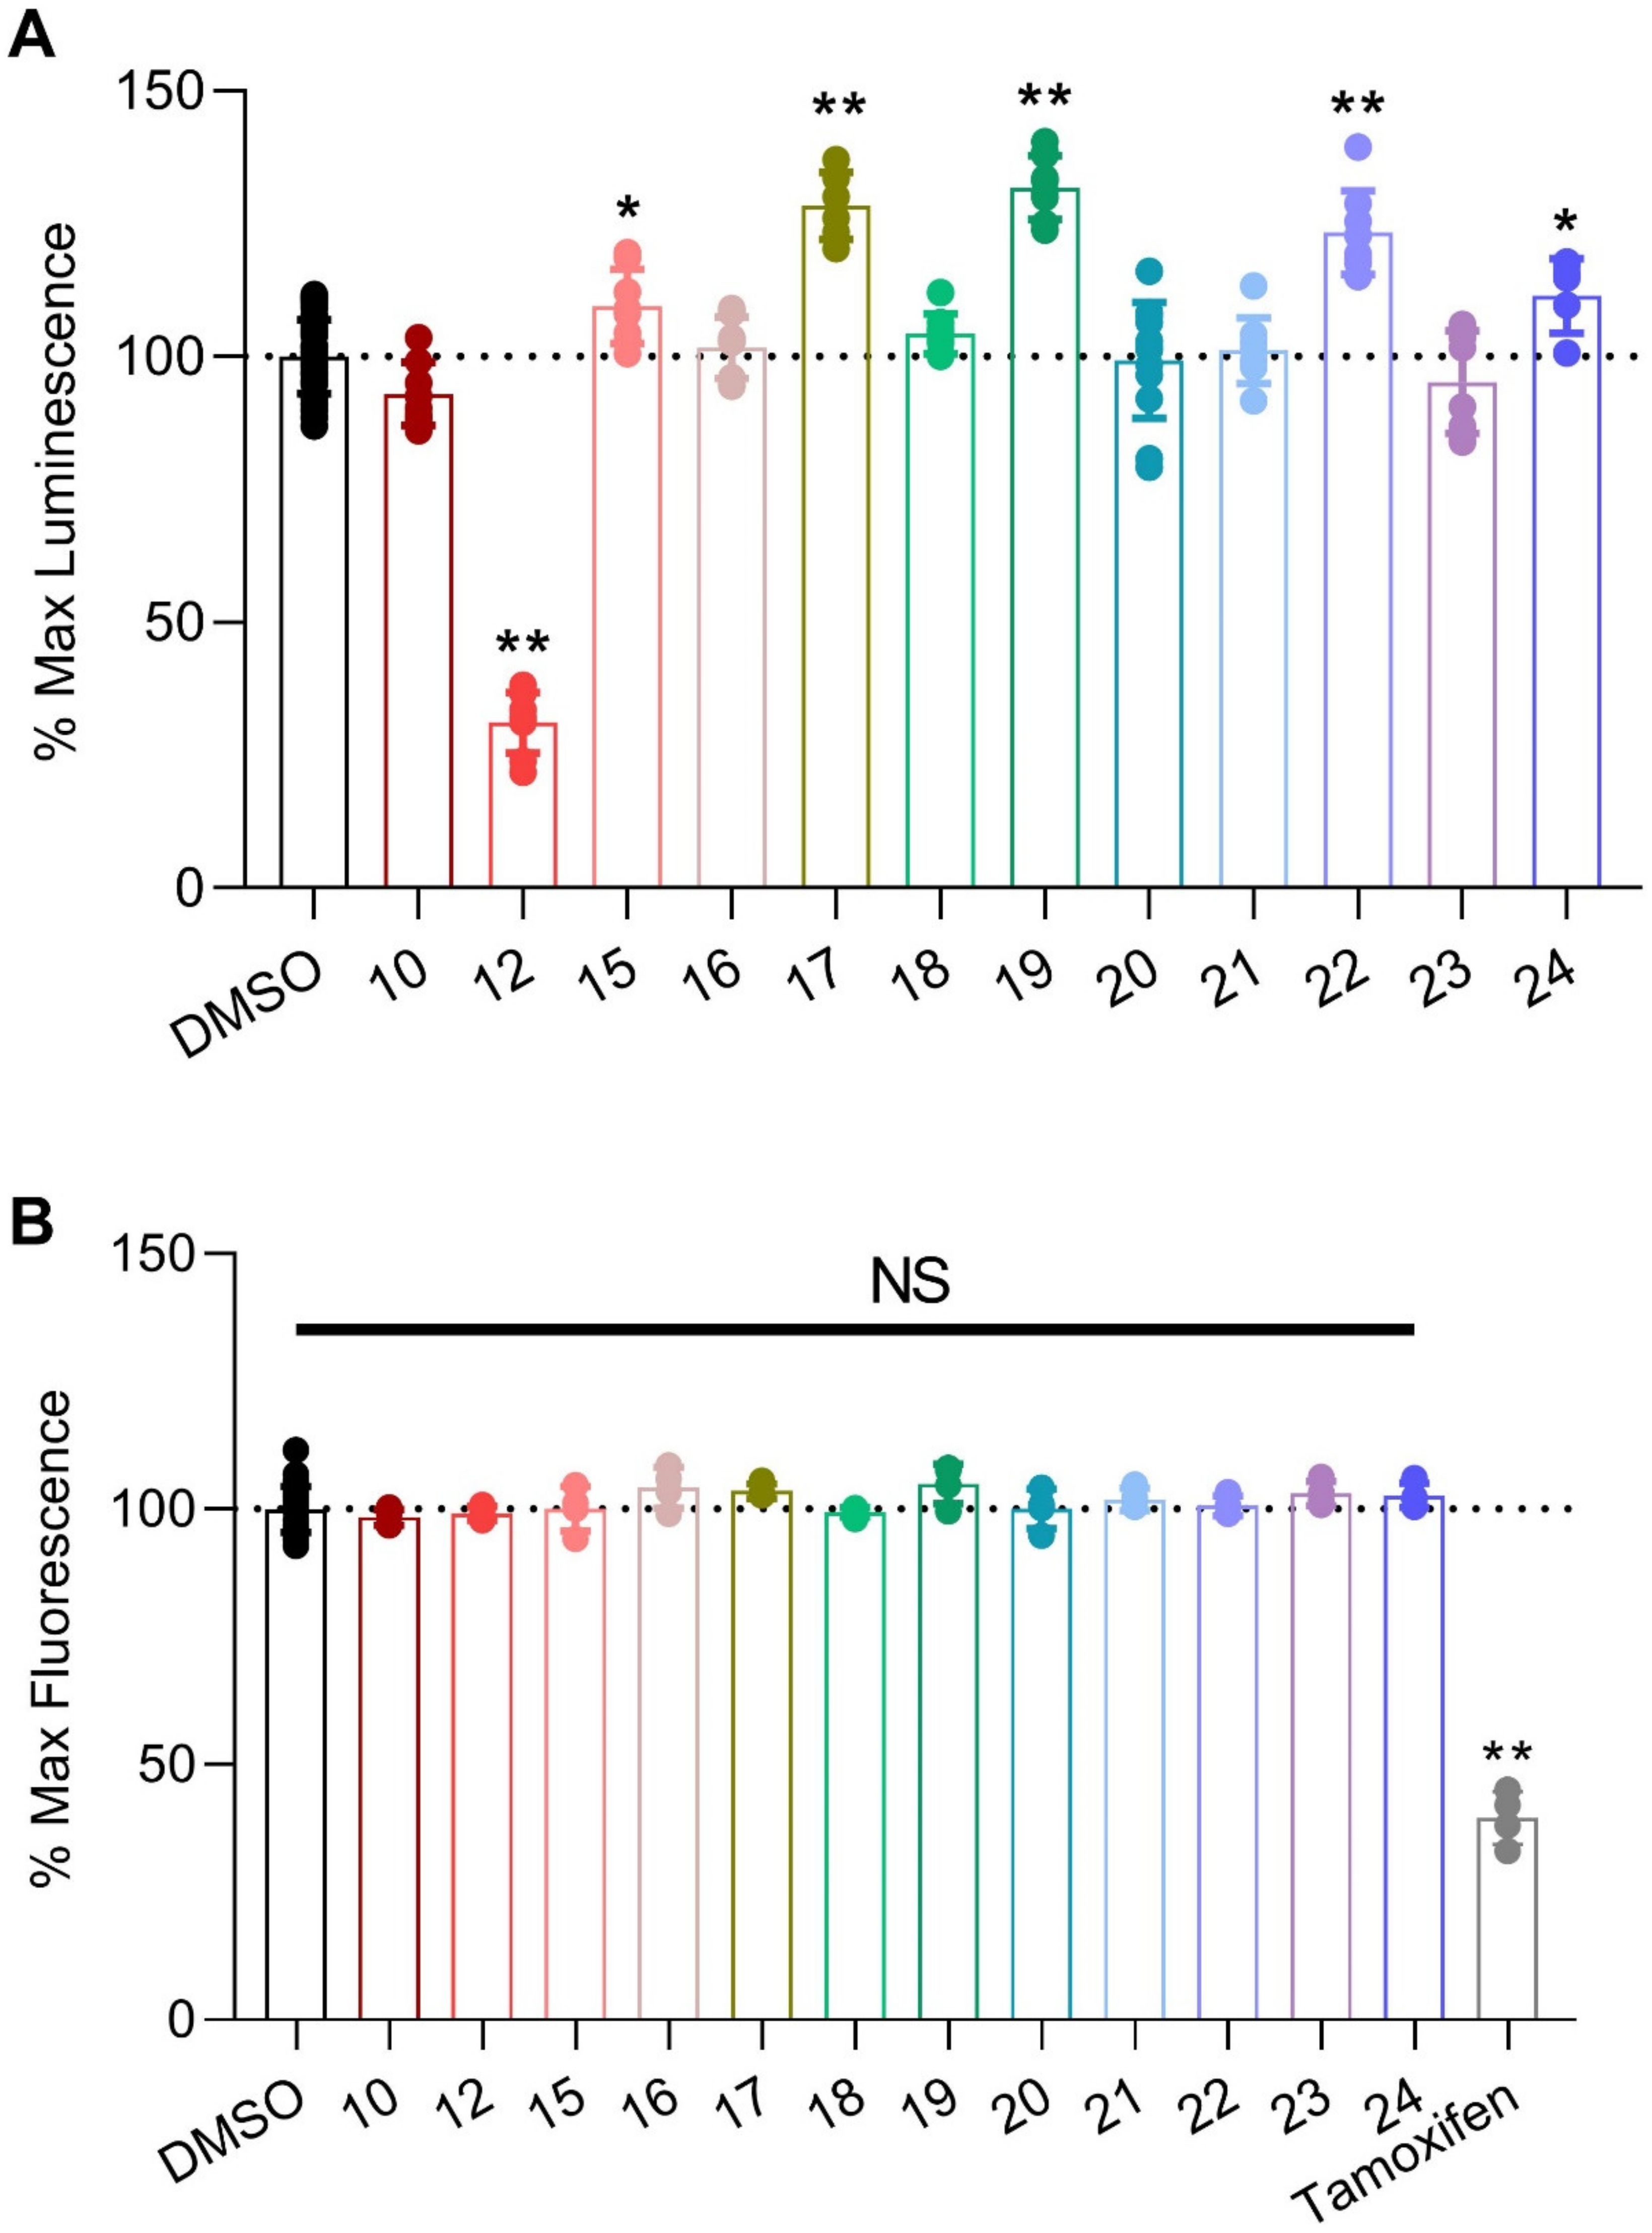
2.2.1. In-Cell Testing of Analogs Using the Split Luciferase Complementation Assay (LCA)
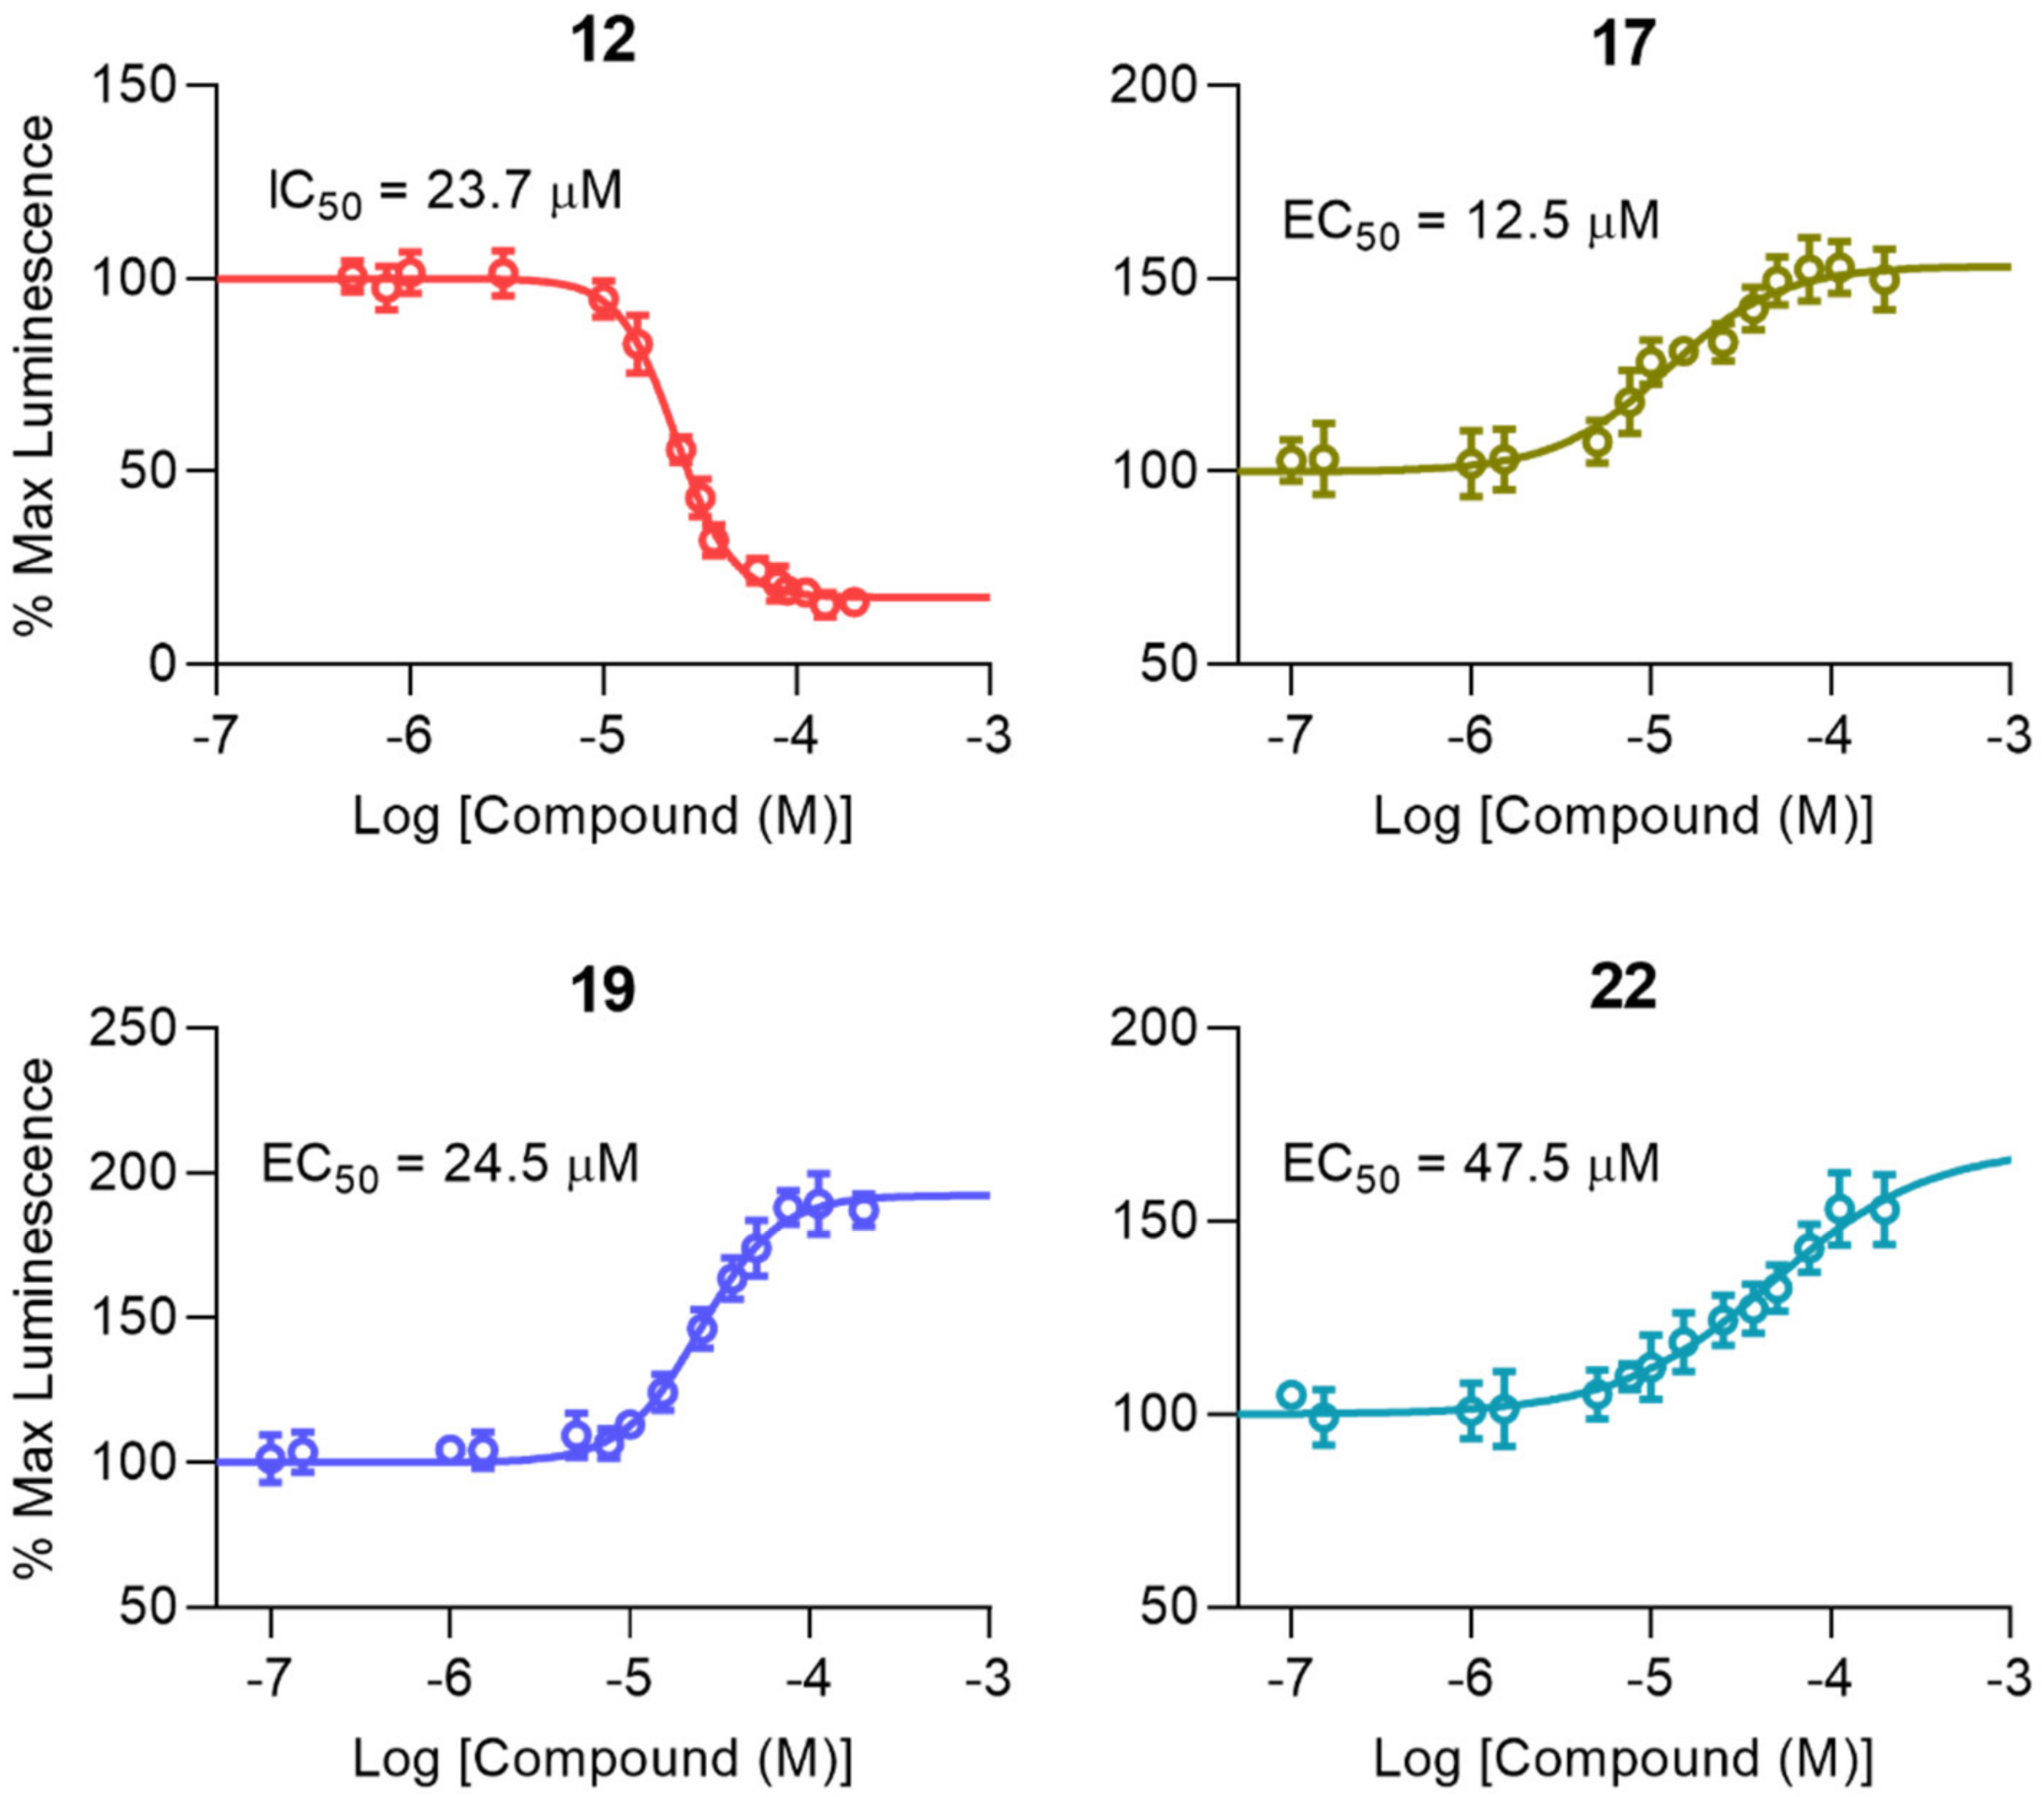
2.2.2. Characterization of Peptidomimetic Interactions with FGF14 and Nav1.6
2.2.3. Electrophysiological Evaluation of Compounds 12 and 19
2.2.4. Molecular Docking Studies of Compounds 12 and 19
3. Discussion
4. Materials and Methods
4.1. Chemistry
4.1.1. General
4.1.2. Synthesis of (9H-fluoren-9-yl)methyl ((S)-1-(((S)-1-amino-3-methyl-1-oxobutan-2-yl)amino)-3-(4-(tert-butoxy)phenyl)-1-oxopropan-2-yl)carbamate (10)
4.1.3. Synthesis of (9H-fluoren-9-yl)methyl ((S)-1-(((S)-1-(((S)-1-amino-3-methyl-1-oxobutan-2-yl)amino)-3-(4-(tert-butoxy)phenyl)-1-oxopropan-2-yl)amino)-3-(4-(tert-butoxy)phenyl)-1-oxopropan-2-yl)carbamate (12)
4.1.4. Synthesis of tert-butyl (S)-4-((((9H-fluoren-9-yl)methoxy)carbonyl)amino)-5-(((S)-1-(((S)-1-(((S)-1-amino-3-methyl-1-oxobutan-2-yl)amino)-3-(4-(tert-butoxy)phenyl)-1-oxopropan-2-yl)amino)-3-(4-(tert-butoxy)phenyl)-1-oxopropan-2-yl)amino)-5-oxopentanoate (15)
4.1.5. Synthesis of methyl (5S,8S,11S,14S)-5-(3-(tert-butoxy)-3-oxopropyl)-8,11-bis(4-(tert-butoxy)benzyl)-1-(9H-fluoren-9-yl)-14-isopropyl-3,6,9,12-tetraoxo-2-oxa-4,7,10,13-tetraazapentadecan-15-oate (16)
4.1.6. Synthesis of tert-butyl (S)-4-acetamido-5-(((S)-1-(((S)-1-(((S)-1-amino-3-methyl-1-oxobutan-2-yl)amino)-3-(4-(tert-butoxy)phenyl)-1-oxopropan-2-yl)amino)-3-(4-(tert-butoxy)phenyl)-1-oxopropan-2-yl)amino)-5-oxopentanoate (17)
4.1.7. Synthesis of methyl (2S,5S,8S,11S)-11-(3-(tert-butoxy)-3-oxopropyl)-5,8-bis(4-(tert-butoxy)benzyl)-2-isopropyl-4,7,10,13-tetraoxo-3,6,9,12-tetraazatetradecanoate (18)
4.1.8. Synthesis of tert-butyl (S)-5-(((S)-1-(((S)-1-(((S)-1-amino-3-methyl-1-oxobutan-2-yl)amino)-3-(4-(tert-butoxy)phenyl)-1-oxopropan-2-yl)amino)-3-(4-(tert-butoxy)phenyl)-1-oxopropan-2-yl)amino)-4-benzamido-5-oxopentanoate (19)
4.1.9. Synthesis of tert-Butyl (S)-4-(3-((3R,5R,7R)-adamantan-1-yl)ureido)-5-(((S)-1-(((S)-1-(((S)-1-amino-3-methyl-1-oxobutan-2-yl)amino)-3-(4-(tert-butoxy)phenyl)-1-oxopropan-2-yl)amino)-3-(4-(tert-butoxy)phenyl)-1-oxopropan-2-yl)amino)-5-oxopentanoate (20)
4.1.10. Synthesis of tert-Butyl (4S)-4-((1S,3R,5S)-adamantane-1-carboxamido)-5-(((S)-1-(((S)-1-(((S)-1-amino-3-methyl-1-oxobutan-2-yl)amino)-3-(4-(tert-butoxy)phenyl)-1-oxopropan-2-yl)amino)-3-(4-(tert-butoxy)phenyl)-1-oxopropan-2-yl)amino)-5-oxopentanoate (21)
4.1.11. Synthesis of tert-Butyl (S)-5-(((S)-1-(((S)-1-(((S)-1-amino-3-methyl-1-oxobutan-2-yl)amino)-3-(4-(tert-butoxy)phenyl)-1-oxopropan-2-yl)amino)-3-(4-(tert-butoxy)phenyl)-1-oxopropan-2-yl)amino)-4-decanamido-5-oxopentanoate (22)
4.1.12. Synthesis of tert-Butyl (S)-5-(((S)-1-(((S)-1-(((S)-1-amino-3-methyl-1-oxobutan-2-yl)amino)-3-(4-(tert-butoxy)phenyl)-1-oxopropan-2-yl)amino)-3-(4-(tert-butoxy)phenyl)-1-oxopropan-2-yl)amino)-4-(cyclohexanecarboxamido)-5-oxopentanoate (23)
4.1.13. Synthesis of tert-Butyl (S)-5-(((S)-1-(((S)-1-(((S)-1-amino-3-methyl-1-oxobutan-2-yl)amino)-3-(4-(tert-butoxy)phenyl)-1-oxopropan-2-yl)amino)-3-(4-(tert-butoxy)phenyl)-1-oxopropan-2-yl)amino)-4-(((benzyloxy)carbonyl)amino)-5-oxopentanoate (24)
4.2. Cell Culture
4.3. Split-Luciferase Complementation Assay (LCA)
4.4. Cell Viability Assay
4.5. Protein Expression and Purification
4.6. Surface Plasmon Resonance Spectroscopy
4.7. Electrophysiology
4.8. Electrophysiology Data Analysis
4.9. Molecular Docking Method
Supplementary Materials
Author Contributions
Funding
Conflicts of Interest
References
- Hille, B. Ionic channels in excitable membranes. Current problems and biophysical approaches. Biophys. J. 1978, 22, 283–294. [Google Scholar] [CrossRef] [Green Version]
- Goldin, A.L. Resurgence of Sodium Channel Research. Annu. Rev. Physiol. 2001, 63, 871–894. [Google Scholar] [CrossRef] [PubMed] [Green Version]
- Mantegazza, M.; Gambardella, A.; Rusconi, R.; Schiavon, E.; Annesi, F.; Cassulini, R.R.; Labate, A.; Carrideo, S.; Chifari, R.; Canevini, M.P.; et al. Identification of an Nav1.1 sodium channel (SCN1A) loss-of-function mutation associated with familial simple febrile seizures. Proc. Natl. Acad. Sci. USA 2005, 102, 18177–18182. [Google Scholar] [CrossRef] [PubMed] [Green Version]
- Claes, L.; Del Favero, J.; Ceulemans, B.; Lagae, L.; Van Broeckhoven, C.; De Jonghe, P. De Novo Mutations in the Sodium-Channel Gene SCN1A Cause Severe Myoclonic Epilepsy of Infancy. Am. J. Hum. Genet. 2001, 68, 1327–1332. [Google Scholar] [CrossRef] [Green Version]
- Escayg, A.; Macdonald, B.T.; Meisler, M.H.; Baulac, S.; Huberfeld, G.; An-Gourfinkel, I.; Brice, A.; LeGuern, E.; Moulard, B.; Chaigne, D.; et al. Mutations of SCN1A, encoding a neuronal sodium channel, in two families with GEFS+2. Nat. Genet. 2000, 24, 343–345. [Google Scholar] [CrossRef] [PubMed]
- Mullen, S.A.; Scheffer, I.E. Translational Research in Epilepsy Genetics. Arch. Neurol. 2009, 66, 21–26. [Google Scholar] [CrossRef] [Green Version]
- Pellacani, S.; Sicca, F.; Di Lorenzo, C.; Grieco, G.S.; Valvo, G.; Cereda, C.; Rubegni, A.; Santorelli, F.M. The Revolution in Migraine Genetics: From Aching Channels Disorders to a Next-Generation Medicine. Front. Cell. Neurosci. 2016, 10, 156. [Google Scholar] [CrossRef] [Green Version]
- Kahlig, K.M.; Rhodes, T.H.; Pusch, M.; Freilinger, T.; Pereira-Monteiro, J.M.; Ferrari, M.D.; Maagdenberg, A.M.J.M.V.D.; Dichgans, M.; George, A.L.J. Divergent sodium channel defects in familial hemiplegic migraine. Proc. Natl. Acad. Sci. USA 2008, 105, 9799–9804. [Google Scholar] [CrossRef] [Green Version]
- Dichgans, M.; Freilinger, T.; Eckstein, G.; Babini, E.; Lorenz-Depiereux, B.; Biskup, S.; Ferrari, M.D.; Herzog, J.; Maagdenberg, A.M.V.D.; Pusch, M.; et al. Mutation in the neuronal voltage-gated sodium channel SCN1A in familial hemiplegic migraine. Lancet 2005, 366, 371–377. [Google Scholar] [CrossRef]
- Weiss, L.A.; Escayg, A.; Kearney, J.A.; Trudeau, M.; Macdonald, B.T.; Mori, M.; Reichert, J.; Buxbaum, J.D.; Meisler, M.H. Sodium channels SCN1A, SCN2A and SCN3A in familial autism. Mol. Psychiatry 2003, 8, 186–194. [Google Scholar] [CrossRef] [Green Version]
- Sanders, S.J.; Campbell, A.J.; Cottrell, J.R.; Møller, R.S.; Wagner, F.F.; Auldridge, A.L.; Bernier, R.A.; Catterall, W.A.; Chung, W.K.; Empfield, J.R.; et al. Progress in Understanding and Treating SCN2A-Mediated Disorders. Trends Neurosci. 2018, 41, 442–456. [Google Scholar] [CrossRef] [PubMed]
- Kruth, K.A.; Grisolano, T.M.; Ahern, C.A.; Williams, A.J. SCN2A channelopathies in the autism spectrum of neuropsychiatric disorders: A role for pluripotent stem cells? Mol. Autism 2020, 11, 1–11. [Google Scholar] [CrossRef] [PubMed] [Green Version]
- Post, R.M.; Ketter, T.A.; Uhde, T.; Ballenger, J.C. Thirty Years of Clinical Experience with Carbamazepine in the Treatment of Bipolar Illness. CNS Drugs 2007, 21, 47–71. [Google Scholar] [CrossRef] [PubMed]
- Post, R.; Frye, M.A.; Denicoff, K.D.; Leverich, G.S.; Kimbrell, T.A.; Dunn, R.T. Beyond Lithium in the Treatment of Bipolar Illness. Neuropsychopharmacology 1998, 19, 206–219. [Google Scholar] [CrossRef] [Green Version]
- Mula, M.; Pini, S.; Cassano, G.B. The Role of Anticonvulsant Drugs in Anxiety Disorders. J. Clin. Psychopharmacol. 2007, 27, 263–272. [Google Scholar] [CrossRef]
- Tiihonen, L.; Hallikainen, T.; Ryynänen, O.-P.; Repo-Tiihonen, E.; Kotilainen, I.; Eronen, M.; Toivonen, P.; Wahlbeck, K.; Putkonen, A. Lamotrigine in treatment-resistant schizophrenia: A randomized placebo-controlled crossover trial. Boil. Psychiatry 2003, 54, 1241–1248. [Google Scholar] [CrossRef]
- Dursun, S.M.; Deakin, B. Augmenting antipsychotic treatment with lamotrigine or topiramate in patients with treatment-resistant schizophrenia: A naturalistic caseseries outcome study. J. Psychopharmacol. 2001, 15, 297–301. [Google Scholar] [CrossRef]
- Dursun, S.M.; McIntosh, D.; Milliken, H. Clozapine plus lamotrigine in treatment-resistant schizophrenia. Arch. Gen. Psychiatry 1999, 56, 950. [Google Scholar] [CrossRef]
- Focken, T.; Burford, K.; Grimwood, M.E.; Zenova, A.; Andrez, J.-C.; Gong, W.; Wilson, M.; Taron, M.; Decker, S.; Lofstrand, V.; et al. Identification of CNS-Penetrant Aryl Sulfonamides as Isoform-Selective NaV1.6 Inhibitors with Efficacy in Mouse Models of Epilepsy. J. Med. Chem. 2019, 62, 9618–9641. [Google Scholar] [CrossRef]
- Ikemoto, S.; Panksepp, J. The role of nucleus accumbens dopamine in motivated behavior: A unifying interpretation with special reference to reward-seeking. Brain Res. Rev. 1999, 31, 6–41. [Google Scholar] [CrossRef]
- Day, J.J.; Carelli, R.M. The nucleus accumbens and Pavlovian reward learning. Neuroscientist 2007, 13, 148–159. [Google Scholar] [CrossRef] [PubMed]
- Setlow, B. The nucleus accumbens and learning and memory. J. Neurosci. Res. 1997, 49, 515–521. [Google Scholar] [CrossRef]
- Gong, W.; Neill, D.; Lynn, M.; Justice, J. Dopamine D1/D2 agonists injected into nucleus accumbens and ventral pallidum differentially affect locomotor activity depending on site. Neuroscientist 1999, 93, 1349–1358. [Google Scholar] [CrossRef]
- Roberts, M.D.; Gilpin, L.; Parker, K.E.; Childs, T.E.; Will, M.; Booth, F.W. Dopamine D1 receptor modulation in nucleus accumbens lowers voluntary wheel running in rats bred to run high distances. Physiol. Behav. 2012, 105, 661–668. [Google Scholar] [CrossRef]
- Dreher, J.K.; Jackson, D.M. Role of D1 and D2 dopamine receptors in mediating locomotor activity elicited from the nucleus accumbens of rats. Brain Res. 1989, 487, 267–277. [Google Scholar] [CrossRef]
- Lim, B.K.; Huang, K.W.; Grueter, B.A.; Rothwell, P.E.; Malenka, R.C. Anhedonia requires MC4R-mediated synaptic adaptations in nucleus accumbens. Nature 2012, 487, 183–189. [Google Scholar] [CrossRef] [Green Version]
- Bessa, J.M.; Morais, M.; Marques, F.; Pinto, L.; Palha, J.A.; Almeida, O.F.X.; Sousa, N. Stress-induced anhedonia is associated with hypertrophy of medium spiny neurons of the nucleus accumbens. Transl. Psychiatry 2013, 3, e266. [Google Scholar] [CrossRef] [Green Version]
- Francis, T.C.; Chandra, R.; Friend, D.M.; Finkel, E.; Dayrit, G.; Miranda, J.; Brooks, J.M.; Iñiguez, S.D.; O’Donnell, P.; Kravitz, A.V.; et al. Nucleus Accumbens Medium Spiny Neuron Subtypes Mediate Depression-Related Outcomes to Social Defeat Stress. Boil. Psychiatry 2015, 77, 212–222. [Google Scholar] [CrossRef] [Green Version]
- Wallace, D.L.; Han, M.-H.; Graham, D.L.; Green, T.A.; Vialou, V.; Iñiguez, S.D.; Cao, J.-L.; Kirk, A.; Chakravarty, S.; Kumar, A.; et al. CREB regulation of nucleus accumbens excitability mediates social isolation–induced behavioral deficits. Nat. Neurosci. 2009, 12, 200–209. [Google Scholar] [CrossRef] [Green Version]
- Liu, Z.; Wadsworth, P.; Singh, A.K.; Chen, H.; Wang, P.; Folorunso, O.; Scaduto, P.; Ali, S.R.; Laezza, F.; Zhou, J. Identification of peptidomimetics as novel chemical probes modulating fibroblast growth factor 14 (FGF14) and voltage-gated sodium channel 1.6 (Nav1.6) protein-protein interactions. Bioorganic Med. Chem. Lett. 2018, 29, 413–419. [Google Scholar] [CrossRef]
- Ali, S.R.; Liu, Z.; Nenov, M.; Folorunso, O.; Singh, A.K.; Scala, F.; Chen, H.; James, T.F.; Alshammari, M.; Panova-Elektronova, N.I.; et al. Functional Modulation of Voltage-Gated Sodium Channels by a FGF14-Based Peptidomimetic. ACS Chem. Neurosci. 2018, 9, 976–987. [Google Scholar] [CrossRef]
- Ali, S.; Shavkunov, A.; Panova, N.; Stoilova-McPhie, S.; Laezza, F. Modulation of the FGF14:FGF14 homodimer interaction through short peptide fragments. CNS Neurol. Disord.-Drug Targets 2014, 13, 1559–1570. [Google Scholar] [CrossRef] [PubMed] [Green Version]
- Wadsworth, P.A.; Folorunso, O.; Nguyen, N.; Singh, A.K.; D’Amico, D.; Powell, R.T.; Brunell, D.; Allen, J.; Stephan, C.; Laezza, F. High-throughput screening against protein:protein interaction interfaces reveals anti-cancer therapeutics as potent modulators of the voltage-gated Na+ channel complex. Sci. Rep. 2019, 9, 1–15. [Google Scholar] [CrossRef]
- Patching, S.G. Surface plasmon resonance spectroscopy for characterisation of membrane protein-ligand interactions and its potential for drug discovery. Biochim. Biophys. Acta BBA Biomembr. 2014, 1838, 43–55. [Google Scholar] [CrossRef] [PubMed] [Green Version]
- Swinney, D.C. The role of binding kinetics in therapeutically useful drug action. Curr. Opin. Drug Discov. Dev. 2009, 12, 31–39. [Google Scholar]
- Ali, S.R.; Singh, A.K.; Laezza, F. Identification of Amino Acid Residues in Fibroblast Growth Factor 14 (FGF14) Required for Structure-Function Interactions with Voltage-gated Sodium Channel Nav1.6*. J. Boil. Chem. 2016, 291, 11268–11284. [Google Scholar] [CrossRef] [PubMed] [Green Version]
- Gardill, B.R.; Rivera-Acevedo, R.E.; Tung, C.-C.; Van Petegem, F. Crystal structures of Ca2+-calmodulin bound to NaV C-terminal regions suggest role for EF-hand domain in binding and inactivation. Proc. Natl. Acad. Sci. USA 2019, 116, 10763–10772. [Google Scholar] [CrossRef] [PubMed] [Green Version]
- Gardill, B.R.; Rivera-Acevedo, R.E.; Tung, C.-C.; Okon, M.; McIntosh, L.P.; Van Petegem, F. The voltage-gated sodium channel EF-hands form an interaction with the III-IV linker that is disturbed by disease-causing mutations. Sci. Rep. 2018, 8, 4483. [Google Scholar] [CrossRef] [Green Version]
- Wang, C.; Chung, B.C.; Yan, H.; Lee, S.-Y.; Pitt, G.S. Crystal Structure of the Ternary Complex of a NaV C-Terminal Domain, a Fibroblast Growth Factor Homologous Factor, and Calmodulin. Structure 2012, 20, 1167–1176. [Google Scholar] [CrossRef] [Green Version]
- Gerfen, C.R.; Surmeier, D.J. Modulation of striatal projection systems by dopamine. Annu. Rev. Neurosci. 2011, 34, 441–466. [Google Scholar] [CrossRef] [Green Version]
- Calabresi, P.; Picconi, B.; Tozzi, A.; Ghiglieri, V.; Di Filippo, M. Direct and indirect pathways of basal ganglia: A critical reappraisal. Nat. Neurosci. 2014, 17, 1022–1030. [Google Scholar] [CrossRef] [PubMed]
- Laezza, F.; Gerber, B.R.; Lou, J.-Y.; Kozel, M.A.; Hartman, H.; Craig, A.M.; Ornitz, D.M.; Nerbonne, J.M. The FGF14F145S Mutation Disrupts the Interaction of FGF14 with Voltage-Gated Na+ Channels and Impairs Neuronal Excitability. J. Neurosci. 2007, 27, 12033–12044. [Google Scholar] [CrossRef] [PubMed] [Green Version]
- Lou, J.-Y.; Laezza, F.; Gerber, B.R.; Xiao, M.; Yamada, K.A.; Hartmann, H.; Craig, A.M.; Nerbonne, J.M.; Ornitz, D.M. Fibroblast growth factor 14 is an intracellular modulator of voltage-gated sodium channels. J. Physiol. 2005, 569, 179–193. [Google Scholar] [CrossRef] [PubMed]
- Pelay-Gimeno, M.; Glas, A.; Koch, O.; Grossmann, T.N. Structure-Based Design of Inhibitors of Protein–Protein Interactions: Mimicking Peptide Binding Epitopes. Angew. Chem. Int. Ed. 2015, 54, 8896–8927. [Google Scholar] [CrossRef] [PubMed]
- Scala, F.; Nenov, M.; Crofton, E.; Singh, A.K.; Folorunso, O.; Zhang, Y.; Chesson, B.C.; Wildburger, N.; James, T.F.; Alshammari, M.A.; et al. Environmental Enrichment and Social Isolation Mediate Neuroplasticity of Medium Spiny Neurons through the GSK3 Pathway. Cell Rep. 2018, 23, 555–567. [Google Scholar] [CrossRef] [Green Version]
- Shavkunov, A.; Panova, N.; Prasai, A.; Veselenak, R.; Bourne, N.; Stoilova-McPhie, S.; Laezza, F. Bioluminescence Methodology for the Detection of Protein–Protein Interactions Within the Voltage-Gated Sodium Channel Macromolecular Complex. ASSAY Drug Dev. Technol. 2012, 10, 148–160. [Google Scholar] [CrossRef]
- Hsu, W.-C.J.; Nenov, M.N.; Shavkunov, A.; Panova, N.; Zhan, M.; Laezza, F. Identifying a Kinase Network Regulating FGF14:Nav1.6 Complex Assembly Using Split-Luciferase Complementation. PLoS ONE 2015, 10, e0117246. [Google Scholar] [CrossRef] [Green Version]
- Frostell-Karlsson, Å.; Remaeus, A.; Roos, H.; Andersson, K.; Borg, P.; Hämäläinen, M.; Karlsson, R. Biosensor analysis of the interaction between immobilized human serum albumin and drug compounds for prediction of human serum albumin binding levels. J. Med. Chem. 2000, 43, 1986–1992. [Google Scholar] [CrossRef]
Sample Availability: Samples of all experimental compounds herein reported are available from the authors. |


| Compound | R1 (for 15–24) | R2 (for 15–24) | cLogP a | tPSA b | LCA (%Lum) c |
|---|---|---|---|---|---|
| 10 (PW01100) |  | 4.94 | 119.76 | 92.9 ± 2.1 | |
| 12 (PW0201) |  | 6.84 | 158.09 | 31.1 ± 2.0 | |
| 15 (PW0202) | NH2 | Fmoc | 7.45 | 213.49 | 109.4 ± 2.5 |
| 16 (PW0210) | OMe | Fmoc | 8.14 | 196.70 | 101.7 ± 2.0 |
| 17 (PW0203) | NH2 | Ac | 4.05 | 204.26 | 128.4 ± 2.6 |
| 18 (PW0220) | OMe | Ac | 4.74 | 187.47 | 104.3 ± 1.3 |
| 19 (PW0204) | NH2 |  | 5.34 | 204.26 | 131.8 ± 1.9 |
| 20 (PW0205) | NH2 |  | 6.18 | 216.29 | 95.3 ± 3.4 |
| 21 (PW0206) | NH2 |  | 6.25 | 204.26 | 101.1 ± 2.2 |
| 22 (PW0207) | NH2 |  | 7.17 | 204.26 | 123.4 ± 2.8 |
| 23 (PW0208) | NH2 |  | 5.60 | 204.26 | 93.8 ± 3.3 |
| 24 (PW0211) | NH2 | Cbz | 5.84 | 213.49 | 111.5 ± 2.5 |
| Compound | IC50/EC50 (µM) a | IMin/EMax (%)a |
|---|---|---|
| 12 | 23.7 ± 0.7 | 18.3 ± 1.2 |
| 17 | 12.5 ± 1.9 b | 153.4 ± 3.5 e |
| 19 | 24.5 ± 1.7 c | 192.4 ± 3.2 f |
| 22 | 47.5 ± 10.6 d | 163.2 ± 6.5 g |
| FGF14 | Nav1.6 | |||||
|---|---|---|---|---|---|---|
| Compound | KD a (µM) | kon (M−1 s−1) | koff (s−1) | KD a (µM) | kon (M−1 s−1) | koff (s−1) |
| 12 | 2.98 ± 0.10 b | 6.44 × 10³ | 1.86 × 10⁻² | 9.69 ± 0.34 e | 4.29 × 10³ | 4.23 × 10⁻² |
| 17 | 14.3 ± 0.96 c | 6.03 × 10³ | 8.80 × 10⁻² | 54.4 ± 10.2 f | 9.01 × 10³ | 7.83 × 10⁻² |
| 19 | 6.49 ± 0.39 d | 2.06 × 10³ | 1.30 × 10⁻² | 2.20 ± 0.08 g | 6.65 × 10³ | 1.50 × 10⁻² |
| 22 | >100 | 6.90 × 10² | 1.09 × 10⁻¹ | >100 | 7.30 × 10² | 1.30 × 10⁻¹ |
| Condition | Peak Current Density (pA/pF) b | Tau of Fast Inactivation (ms) c | V1/2 of Activation (mV) d | V1/2 of Steady-state Inactivation (mV) e | Long Term Inactivation (Depolarization Cycles 2–4) f | ||
|---|---|---|---|---|---|---|---|
| 2 | 3 | 4 | |||||
| DMSO | –55.39 ± 2.16 (10) | 1.17 ± 0.09 (7) | –20.04 ± 0.85 (10) | –58.58 ± 1.90 (5) | 0.89 ± 0.03 | 0.86 ± 0.03 | 0.85 ± 0.04 (6) |
| 12 | –18.30 ± 2.02 ** (10) | 1.30 ± 0.11 (7) | –20.40 ± 0.89 (10) | –57.59 ± 0.56 (6) | 0.88 ± 0.03 | 0.76 ± 0.03 * | 0.70 ± 0.04 * (7) |
| 19 | –79.63 ± 3.55 ** (8) | 1.12 ± 0.07 (7) | –22.49 ± 0.72 * (8) | –58.53 ± 1.69 (8) | 0.83 ± 0.02 | 0.73 ± 0.02 * | 0.73 ± 0.03 * (8) |
© 2020 by the authors. Licensee MDPI, Basel, Switzerland. This article is an open access article distributed under the terms and conditions of the Creative Commons Attribution (CC BY) license (http://creativecommons.org/licenses/by/4.0/).
Share and Cite
Dvorak, N.M.; Wadsworth, P.A.; Wang, P.; Chen, H.; Zhou, J.; Laezza, F. Bidirectional Modulation of the Voltage-Gated Sodium (Nav1.6) Channel by Rationally Designed Peptidomimetics. Molecules 2020, 25, 3365. https://doi.org/10.3390/molecules25153365
Dvorak NM, Wadsworth PA, Wang P, Chen H, Zhou J, Laezza F. Bidirectional Modulation of the Voltage-Gated Sodium (Nav1.6) Channel by Rationally Designed Peptidomimetics. Molecules. 2020; 25(15):3365. https://doi.org/10.3390/molecules25153365
Chicago/Turabian StyleDvorak, Nolan M., Paul A. Wadsworth, Pingyuan Wang, Haiying Chen, Jia Zhou, and Fernanda Laezza. 2020. "Bidirectional Modulation of the Voltage-Gated Sodium (Nav1.6) Channel by Rationally Designed Peptidomimetics" Molecules 25, no. 15: 3365. https://doi.org/10.3390/molecules25153365