 Zhe Li1,2†
 Xueli Zhao2†
 Lingfang Feng2†Yu Zhao2Wen Pan2Ying Liu2
 Ming Yin2
 Yan Yue2
 Xiaojia Fang2Guorui Liu2Shigeng Gao2
 Xiaobin Zhang2Norden Eh Huang3
 Xiangdong Du2*
 Rui Chen1*
- 1Sleep Center, The Second Affiliated Hospital of Soochow University, Suzhou, China
- 2Sleep Center, Suzhou Psychiatric Hospital, The Affiliated Guangji Hospital of Soochow University, Suzhou, China
- 3AidiSciTech Research Institute, Nanjing, China
Study Objectives: The purpose of this study was to determine the effects of daytime transcranial direct current stimulation (tDCS) on sleep electroencephalogram (EEG) in patients with depression.
Methods: The study was a double-blinded, randomized, controlled clinical trial. A total of 37 patients diagnosed with a major depression were recruited; 19 patients (13 females and 6 males mean age 44.79 ± 15.25 years) received tDCS active stimulation and 18 patients (9 females and 9 males; mean age 43.61 ± 11.89 years) received sham stimulation. Ten sessions of daytime tDCS were administered with the anode over F3 and the cathode over F4. Each session delivered a 2 mA current for 30 min per 10 working days. Hamilton-24 and Montgomery scales were used to assess the severity of depression, and polysomnography (PSG) was used to assess sleep structure and EEG complexity. Eight intrinsic mode functions (IMFs) were computed from each EEG signal in a channel. The sample entropy of the cumulative sum of the IMFs were computed to acquire high-dimensional multi-scale complexity information of EEG signals.
Results: The complexity of Rapid Eye Movement (REM) EEG signals significantly decreased intrinsic multi-scale entropy (iMSE) (1.732 ± 0.057 vs. 1.605 ± 0.046, P = 0.0004 in the case of the C4 channel, IMF 1:4 and scale 7) after tDCS active stimulation. The complexity of the REM EEG signals significantly increased iMSE (1.464 ± 0.101 vs. 1.611 ± 0.085, P = 0.001 for C4 channel, IMF 1:4 and scale 7) after tDCS sham stimulation. There was no significant difference in the Hamilton-24 (P = 0.988), Montgomery scale score (P = 0.726), and sleep structure (N1% P = 0.383; N2% P = 0.716; N3% P = 0.772) between the two groups after treatment.
Conclusion: Daytime tDCS changed the complexity of sleep in the REM stage, and presented as decreased intrinsic multi-scale entropy, while no changes in sleep structure occurred. This finding indicated that daytime tDCS may be an effective method to improve sleep quality in depressed patients. Trial registration This trial has been registered at the ClinicalTrials.gov (protocol ID: TCHIRB-10409114, in progress).
Introduction
Major depressive disorder (MDD) is a common mental disorder with high recurrence and disability rates. Specifically, the annual and lifetime prevalence rates are as high as 6.6 and 16.2% (1). Recurrences leave patients with a heavy economic burden, a lower quality of life, and could be incremental (2). Between 50 and 90% of patients with depression complain about sleep disturbances (3). The symptoms of depression are complex and changeable, among which sleep disturbance is prominent, and early awakening is the characteristic sleep change of depression (4). Common sleep subjective characteristics in patients with depression include insomnia, light sleep, more dreams, easy awakening at night and so on. Polysomnography (PSG) is widely used to detect objective sleep structure in patients with depression. PSG research started in the 1960s with studies showing that major depression is characterized by alterations in sleep continuity (5). Because other sleep disturbances are common among other mental disorders, rapid eye movement (REM) sleep disturbances are considered a characteristic manifestation of depression disorders (6). In 1966 Hartmann et al. (7) reported that the REM sleep latency of patients with a depression disorder shortened at the beginning of sleep, while the proportion of REM increased. Some studies have shown that REM sleep in depressed patients tends to normalize after treatment (3, 8). A shortened REM sleep latency that exists after remission of depressive symptoms indicates that patients have a higher risk of relapse (8).
In the past, MDD patients have been mainly treated with pharmaco- and psycho-therapy (9). The shortcomings of pharmacotherapy include the lack of early onset response to treatment and side effects, which frequently cause treatment non-compliance (10). Non-invasive brain stimulation (NIBS) is increasingly used as an additive treatment for depression. Two major types of NIBS techniques are currently in use for clinical and research [transcranial magnetic stimulation (TMS) and transcranial direct current stimulation (tDCS)] (11). The latter technique, tDCS, delivers a weak current (1–2 mA) to the scalp for 10 min to regulate the membrane potential, which affects cortical activity and induces transient changes in brain function (12). Studies on tDCS and sleep have shown that using tDCS at night increases slow-wave sleep in healthy people (13). Studies have also shown that tDCS improves subjective sleep quality in college students (14). A subsequent analysis, however, revealed that tDCS treatment at night increases arousal in insomniacs (15). Existing studies have explored the efficacy of tDCS in the treatment of depression (16). tDCS is mostly treated in the daytime, with a frequency of five times a week, but few studies have explored the subjective and objective sleep quality at night (17–21).
An electroencephalogram (EEG) is a suitable option as a tool to investigate the brain. As a result, this method has been widely used for biomedical investigation (22, 23). The common methods of EEG signal analysis are linear and non-linear dynamic analyses. Studies have shown that non-linear EEG analysis can effectively explore the complexity of the human brain (24–26). Multi-scale entropy (MSE) is a typical non-linear approach, and the entropy of sleep EEG signals facilitates assessing the trajectory of brain maturation in newborns (27) and the characteristics of pathologic conditions, such as Parkinson’s disease (28). There are two significant drawbacks to MSE. MSE does not reflect the presence of high frequencies in the signal. MSE is not adapted to non-stationary or non-linear signals (29), which are unluckily the characteristics of sleep EEG signals. To overcome these drawbacks, intrinsic MSE (iMSE) was applied in this study.
Current studies have shown that even a single tDCS treatment lasts for at least 24 h (30). As a treatment, it is more practical to implement therapy during the day in the clinic. Thus, we sought to determine if use of tDCS during the daytime improve Sleep EEG complexity at night in depressed patients?
Materials and Methods
Study Design and Setting
Full details of the study design, rationale, and methods as reported in compliance with CONSORT guidelines have been previously published (31). The CONSORT checklist is shown in Figure 1. The current study was a parallel, randomized, double-blinded, sham-controlled design with participants in an initial 2-week RCT phase. All participants completed the treatment during the daytime (five times per week for 2 weeks). The trial was registered and approved by the Ethics Committee of Suzhou Guangji Hospital (ClinicalTrials.gov ID: TCHIRB-10409114). All patients signed the informed consent.
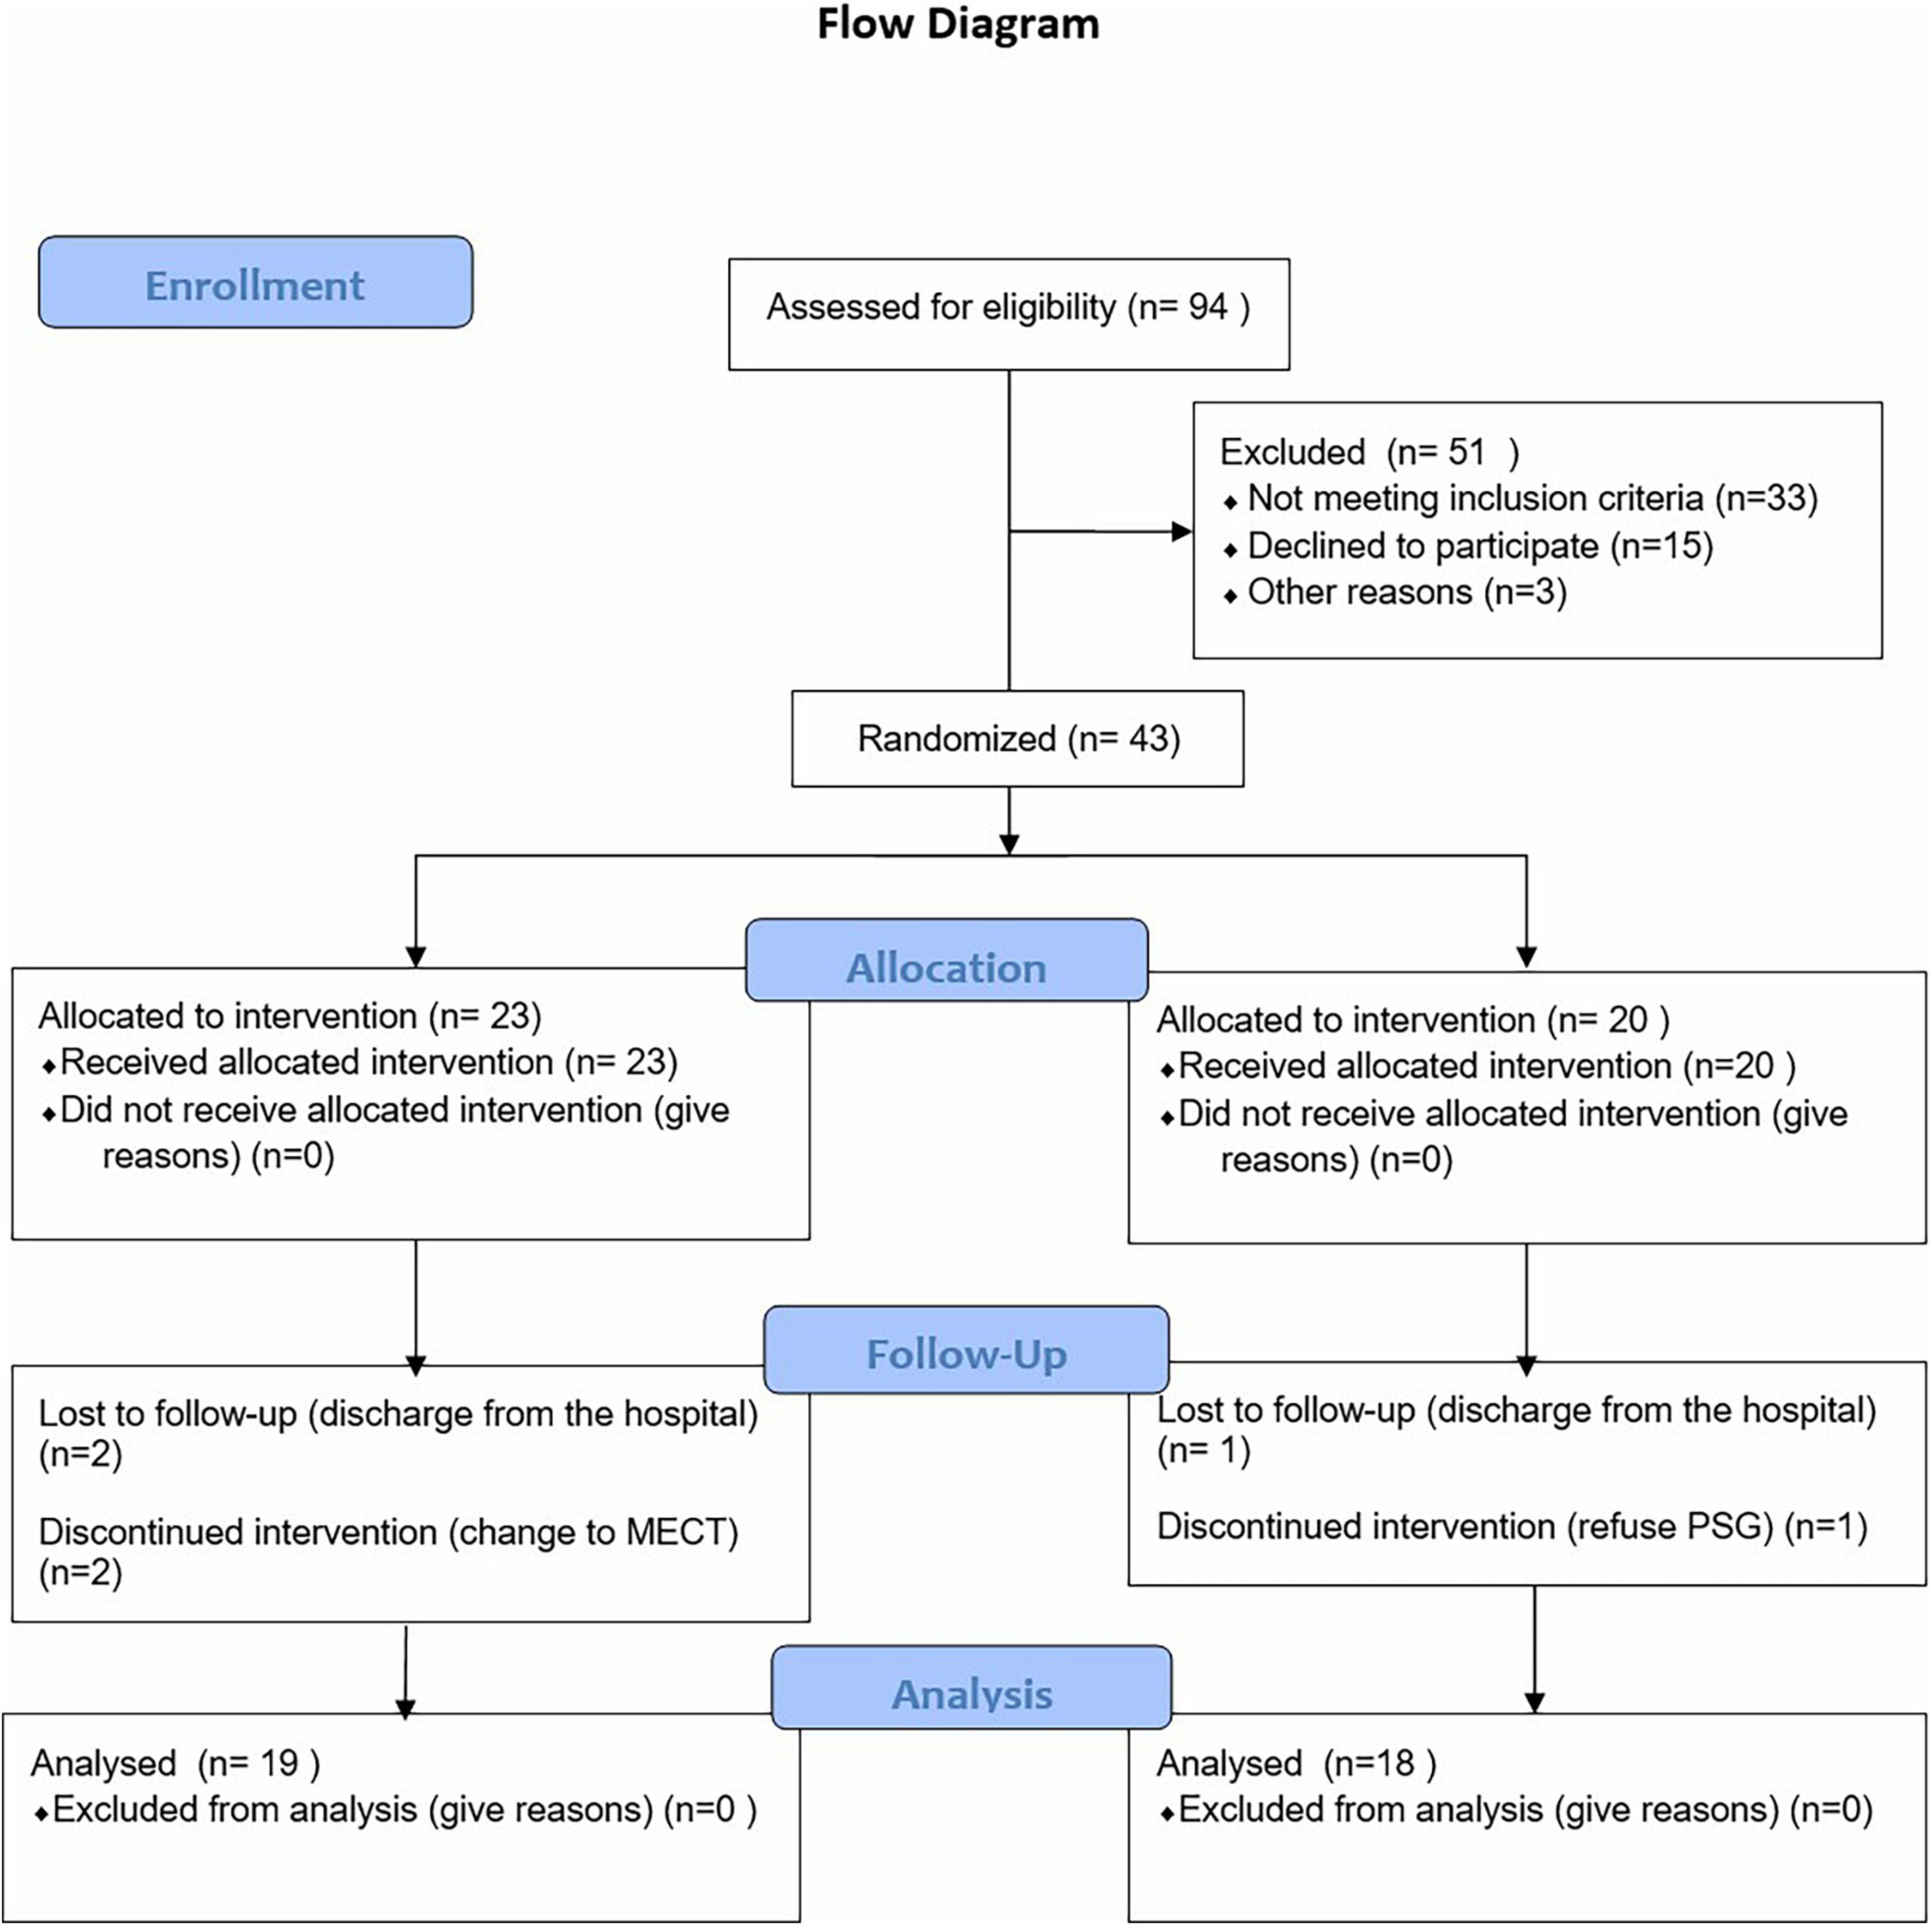
Figure 1. Flow diagram of the progress through the phases of a parallel randomized trial of two groups.
Participants
Inclusion and Exclusion Criteria
The inclusion criteria were as follows: (1) patients 20–65 years of age diagnosed with MDD according to DSM-5; (2) Hamilton Depression Rating scale-24 item (HDRS-24) score ≥20 with a third suicide factor score <3; (3) cognitive function sufficient to understand the research content and obtain informed consent; (4) escitalopram (20 mg/day) or duloxetine hydrochloride (60 mg/day) for 2 weeks; and (5) right-handed patients.
The exclusion criteria were as follows: (1) patients diagnosed with other psychiatric disorders, such as bipolar disorder or schizophrenia; (2) patients currently treated with modified electroconvulsive therapy (MECT) or rTMS within 6 months; (3) patients with severe medical and surgical diseases (epilepsy, dementia, craniocerebral injury, and severe liver dysfunction); and (4) recurrent headaches and skin allergies in the past.
Randomize and Interventions
Randomization
First, patients admitted to the ward diagnosed with depression were evaluated, screened out according to the admission criteria, and informed consent was signed. Patients completed PSG and scale assessments at baseline. Then, after 2 weeks of treatment with escitalopram (20 mg/day) or duloxetine (60 mg/day), the patients were divided into active group or sham group according to a random counting table by the operating technician. After 10 tDCS treatments over a 2-week period, the patients were reassessed with a scale and PSG.
Interventions
Treatment was performed in a quiet environment with minimal communication between the therapist and the subject; the patient was not permitted to fall asleep. The anodes and cathodes were connected to 35-cm2 sponges soaked with 0.9% brine. According to the 10–20 system, F3 is the anode and F4 is the cathode.
The active tDCS group received 2-mA tDCS, and the current dose to the required parameter in 30 s. The stimulation lasted 20 min 5 times a week for a total of 10 stimulations. While the sham tDCS group had current for the first 10 s, and the current dropped to zero in 10–30 s, after which no current existed for the next 20 min. The sham button comes with the machine. The operator only needs to open the sham button.
Measures
Measurement of Depression Severity
The severity of depression was measured at baseline and after tDCS using the Hamilton Depression Rating Scale (HDRS-24) and Montgomery scales (MARDS).
Polysomnography
Polysomnography is defined as the continuous monitoring and simultaneous recording of physiologic activity during sleep (32). PSG was used to record sleep EEG signals. The subjects were recorded while lying in an electromagnetic shielding chamber. Standard scalp electrodes were placed by the International 10–20 System; C3, C4, F3, F4, O1, and O2 referred to mastoid electrodes. The EEG was recorded at a 128-Hz sample frequency. Impedances were <5,000 ohms. Monitoring was performed using the SOMNOmedics V6 PSG system (company, city, Germany), with electrodes and sensors placed in a sleep diagnostic montage, as follows: six brain leads (F4 – M1, F3 – M2, C4 – M1, C3 – M2, O2 – M1, and O1 – M2); two eye movement leads (E1 – M2 and E2 – M2); 2 mandible muscle leads (CHIN1 – chinZ and CHIN2 – chinZ); left and right tibia anterior muscle conductance; and cardiac conductance. Subjects also wore oral and nasal heat sensors, nasal pressure sensors, RIP chest and abdomen breath sensing plethysmography tape, microphone snores sensor, a Nonin finger pulse oxygen saturation probe, and a posture sensor. Sleep technicians manually analyzed sleep and related events according to the AASM Manual for the Scoring of Sleep and Associated Events rules [version 2.2 (33)], then a sleep physician issued a report.
Intrinsic Multi-Scale Entropy
The sleep EEG signals were assessed by the iMSE method, which is quite suitable for non-linear and non-stationary EEG signals.
For each sleep stage of each participant, iMSE was calculated on eight parts of continuous 1,000 EEG data points (7.8125s). Artifacts, such as eye movements, blinks, muscle activities, or other artifacts, were excluded by independent component analysis (ICA). The artifacts were also visually checked.
The iMSE consists of two major parts: to compute the intrinsic mode functions (IMFs) of the sleep EEG signal; and compute the MSE of the cumulative sums of each of the IMFs. The IMFs were extracted with the empirical mode decomposition (EMD), which expanded a given time series into a set of narrowband oscillatory modes that emerged naturally from the inherent oscillatory modes within the signal (34). Those modes were termed IMFs and are data-driven.
In this study iMSE was applied to analyze sleep EEG signals of depressed patients before and after active/sham tDCS stimulation.
The calculation of iMSE was divided into two major steps EMD [i] and MSE calculation.
Part 1 Empirical mode decomposition.
An input signal.
was decomposed into a series of IMFs with EMD in the following process:
First, the upper and lower envelopes were acquired by connecting the local maxima and minima of the signal, respectively, with cubic splines.
Second, the average of the two envelopes was then removed from the original signal.
The sifting process (envelopes-acquiring and average-removing) was then repeated several times (usually 10 times). The first set of the sifting process obtained the first IMF, which carried higher frequencies than the residual signal with the first IMF removed.
Then, the residual signal was deemed as the input for a new round of iterations. In each sifting process turn, IMFs with lower frequencies were derived from the newly obtained residue of the last turn.
Finally, the result of the EMD was a decomposition of the signal [y0(t)] into the sum of the IMFs and a residue [r(t)]. That is,
where nm is the number of IMFs (35).
Part 2 MSE calculation.
1. The “multi-scale” of MSE was reflected in the process of coarse-graining, which was carried out in the following ways:
For scale τ = 1, is the original signal and the length of the signal after coarse graining is N/τ.
2. Sample entropy was calculated for each coarse-grained time series. Sample entropy was calculated in the following way:
where Cm(r) represents the ratio of sequence pairs the distance of which is <r and the whole sequence pairs after the sequence u(1),u(2),…,u(N) is divided into N − m+1 sequences, the length of which is m (36).
Outcome Measures
The primary outcome was change in the iMSE and sleep structure of PSG over the 2-week RCT phase. Secondary measures were HDRS-24 total and factor scores.
Numbers Analyzed
Due to the lack of previous work on iMSE-based clinical improvements before and after tDCS intervention in depression, the sample size calculation was not feasible. Instead, we surveyed similar work, and their sample sizes are 10 (37), 7 (38), 37 (39). Thus we planned to recruit at least 30 depressive patients for our study.
Blinding
Patients and scale evaluators were blinded to group assignment. The technician covers the instrument during treatment so that the patient cannot see the treatment parameters.
Statistical Analysis
The Chi-square test was performed to detect differences in primary physiological markers between the two groups. The mean () and standard deviation (s) are expressed as in tables.
A paired t-test or rank sum test were performed to detect differences in sleep structure and EEG complexity between pre- and post-treatment at every electrode site, every scale of MSE, and every IMF of EEG signals for active tDCS and sham tDCS groups. The alpha significance level was set at 0.05 and the 95% CI was also calculated.
The EEG complexity is acquired in multi-scale form, with different IMFs, scales of MSE, and electrode sites. Typically, the difference in EEG complexity before and after the stimulation is calculated in the case of channel C3, IMF 1:4, and MSE scale 7, the results of which are presented in the medians-quartiles form.
The sleep structure and HRDS-24 subscores were also analyzed using a two-sample t-test to detect early, middle, and late insomnia differences between active and sham groups.
Results
Ninety-four patients admitted to the Sleep Department of Suzhou Guangji Hospital from October 2019 to December 2020 were evaluated. Among the patients, 33 did not meet inclusion criteria, 15 patients declined to participate, and 3 were discharged from the hospital without a cure after evaluation. Finally, 43 patients [active group (27) vs. sham group (24)] signed informed consent for the study, of whom 6 did not continue (Figure 1). In addition, patients were treated with monotherapy (escitalopram [20 mg/day] or duloxetine [60 mg/day]) 2 weeks after which the patients were randomly divided into active tDCS group (n = 23) and sham group (n = 20) using a random count table.
There were no statistically significant demographic or clinical characteristics differences (Table 1).
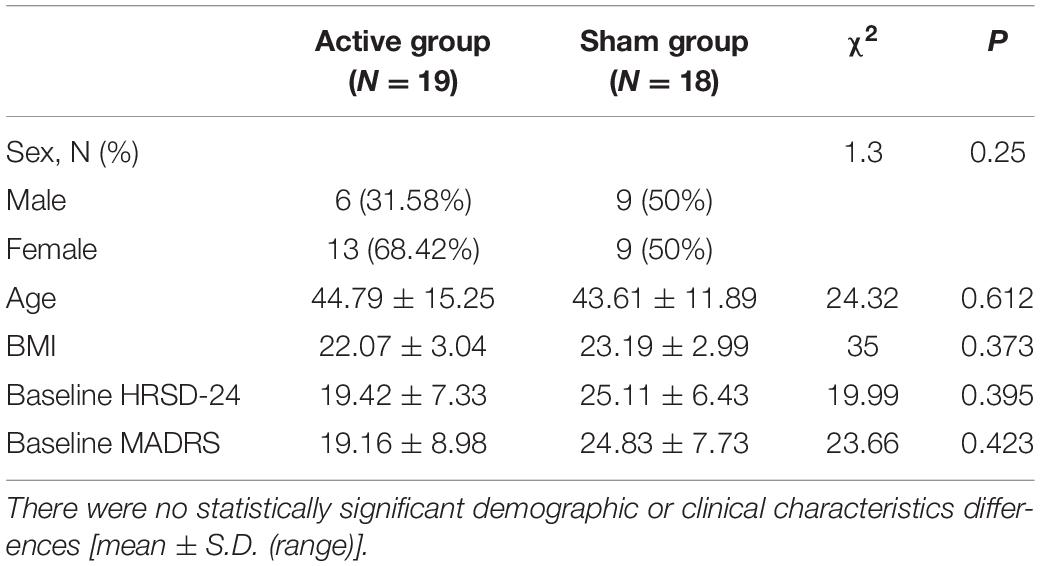
Table 1. Clinical characteristics of active and sham groups at baseline.
After active stimulation there was a significantly decreased iMSE compared with pre-treatment for the REM stage (Figure 2). In addition, after sham stimulation there was a significantly increased iMSE compared with pretreatment (Figure 3).
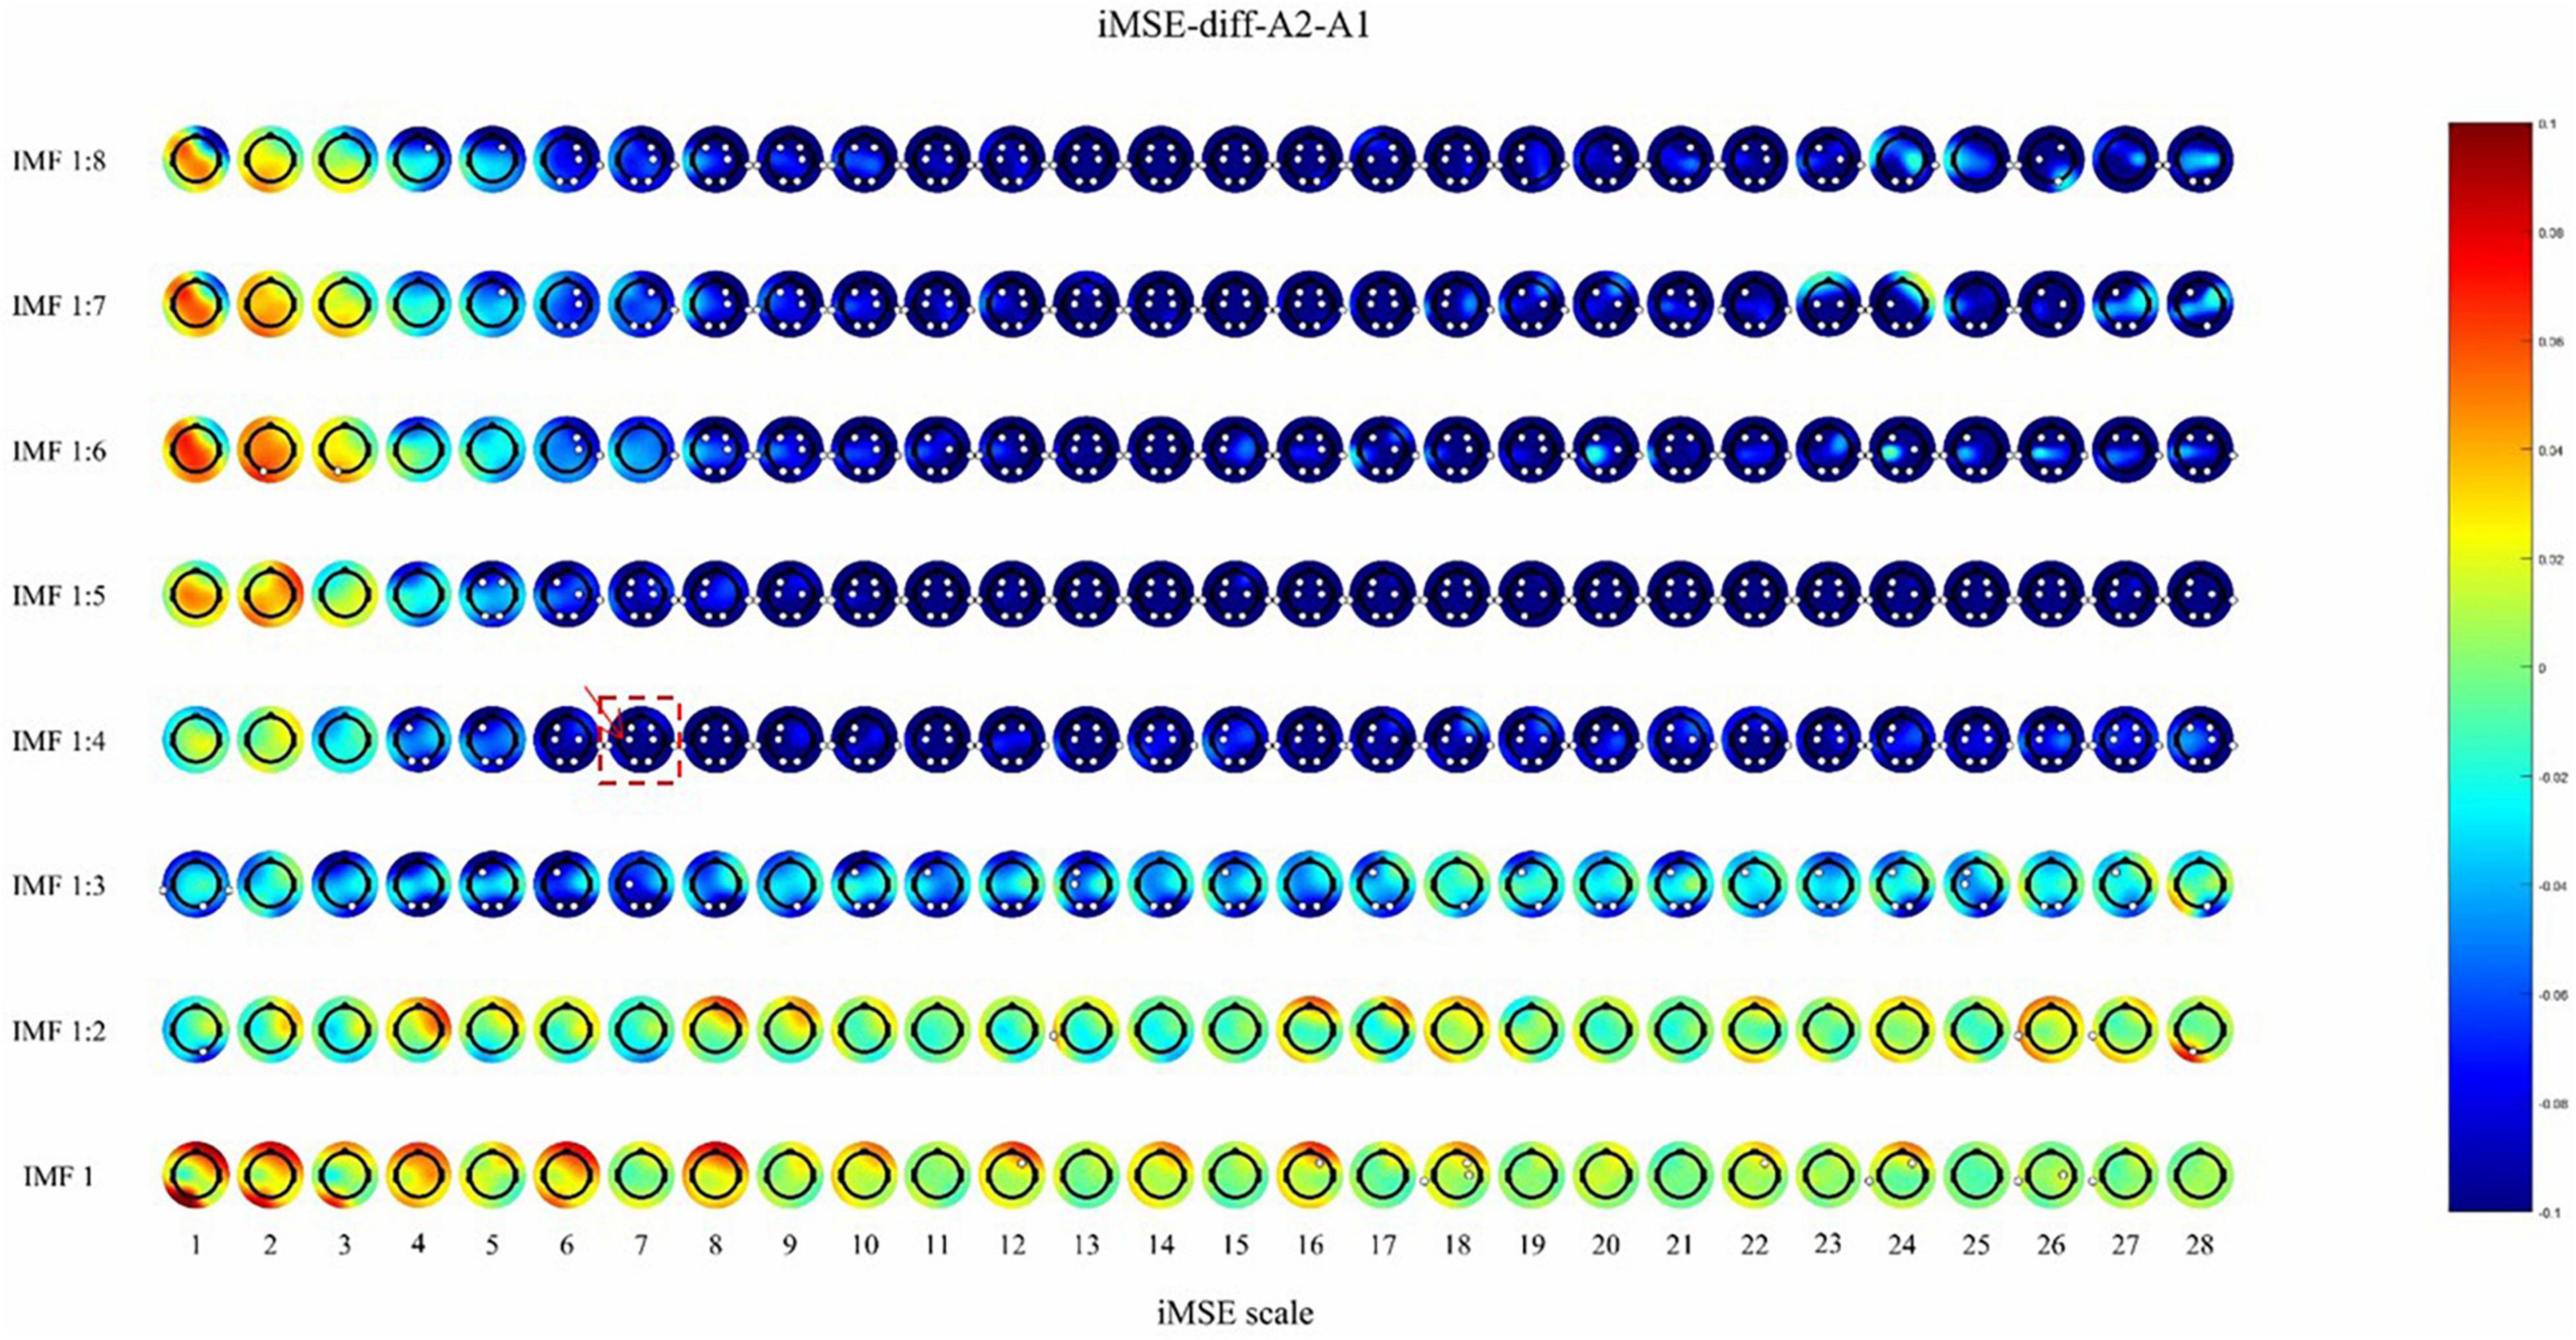
Figure 2. The difference before and after active stimulation in iMSE for REM stage. Negative values indicate decreased iMSE after stimulation. The small white dots indicate significant differences (p < 0.05). the color reflects the difference in the sleep EEG complexity before and after the stimulation. For example, the position where the color is blue, corresponding to –0.08 on the color bar, indicates that the EEG complexity decreased by 0.08 after stimulation. The white dots indicate that there is a significant difference (p < 0.05) in EEG complexity.
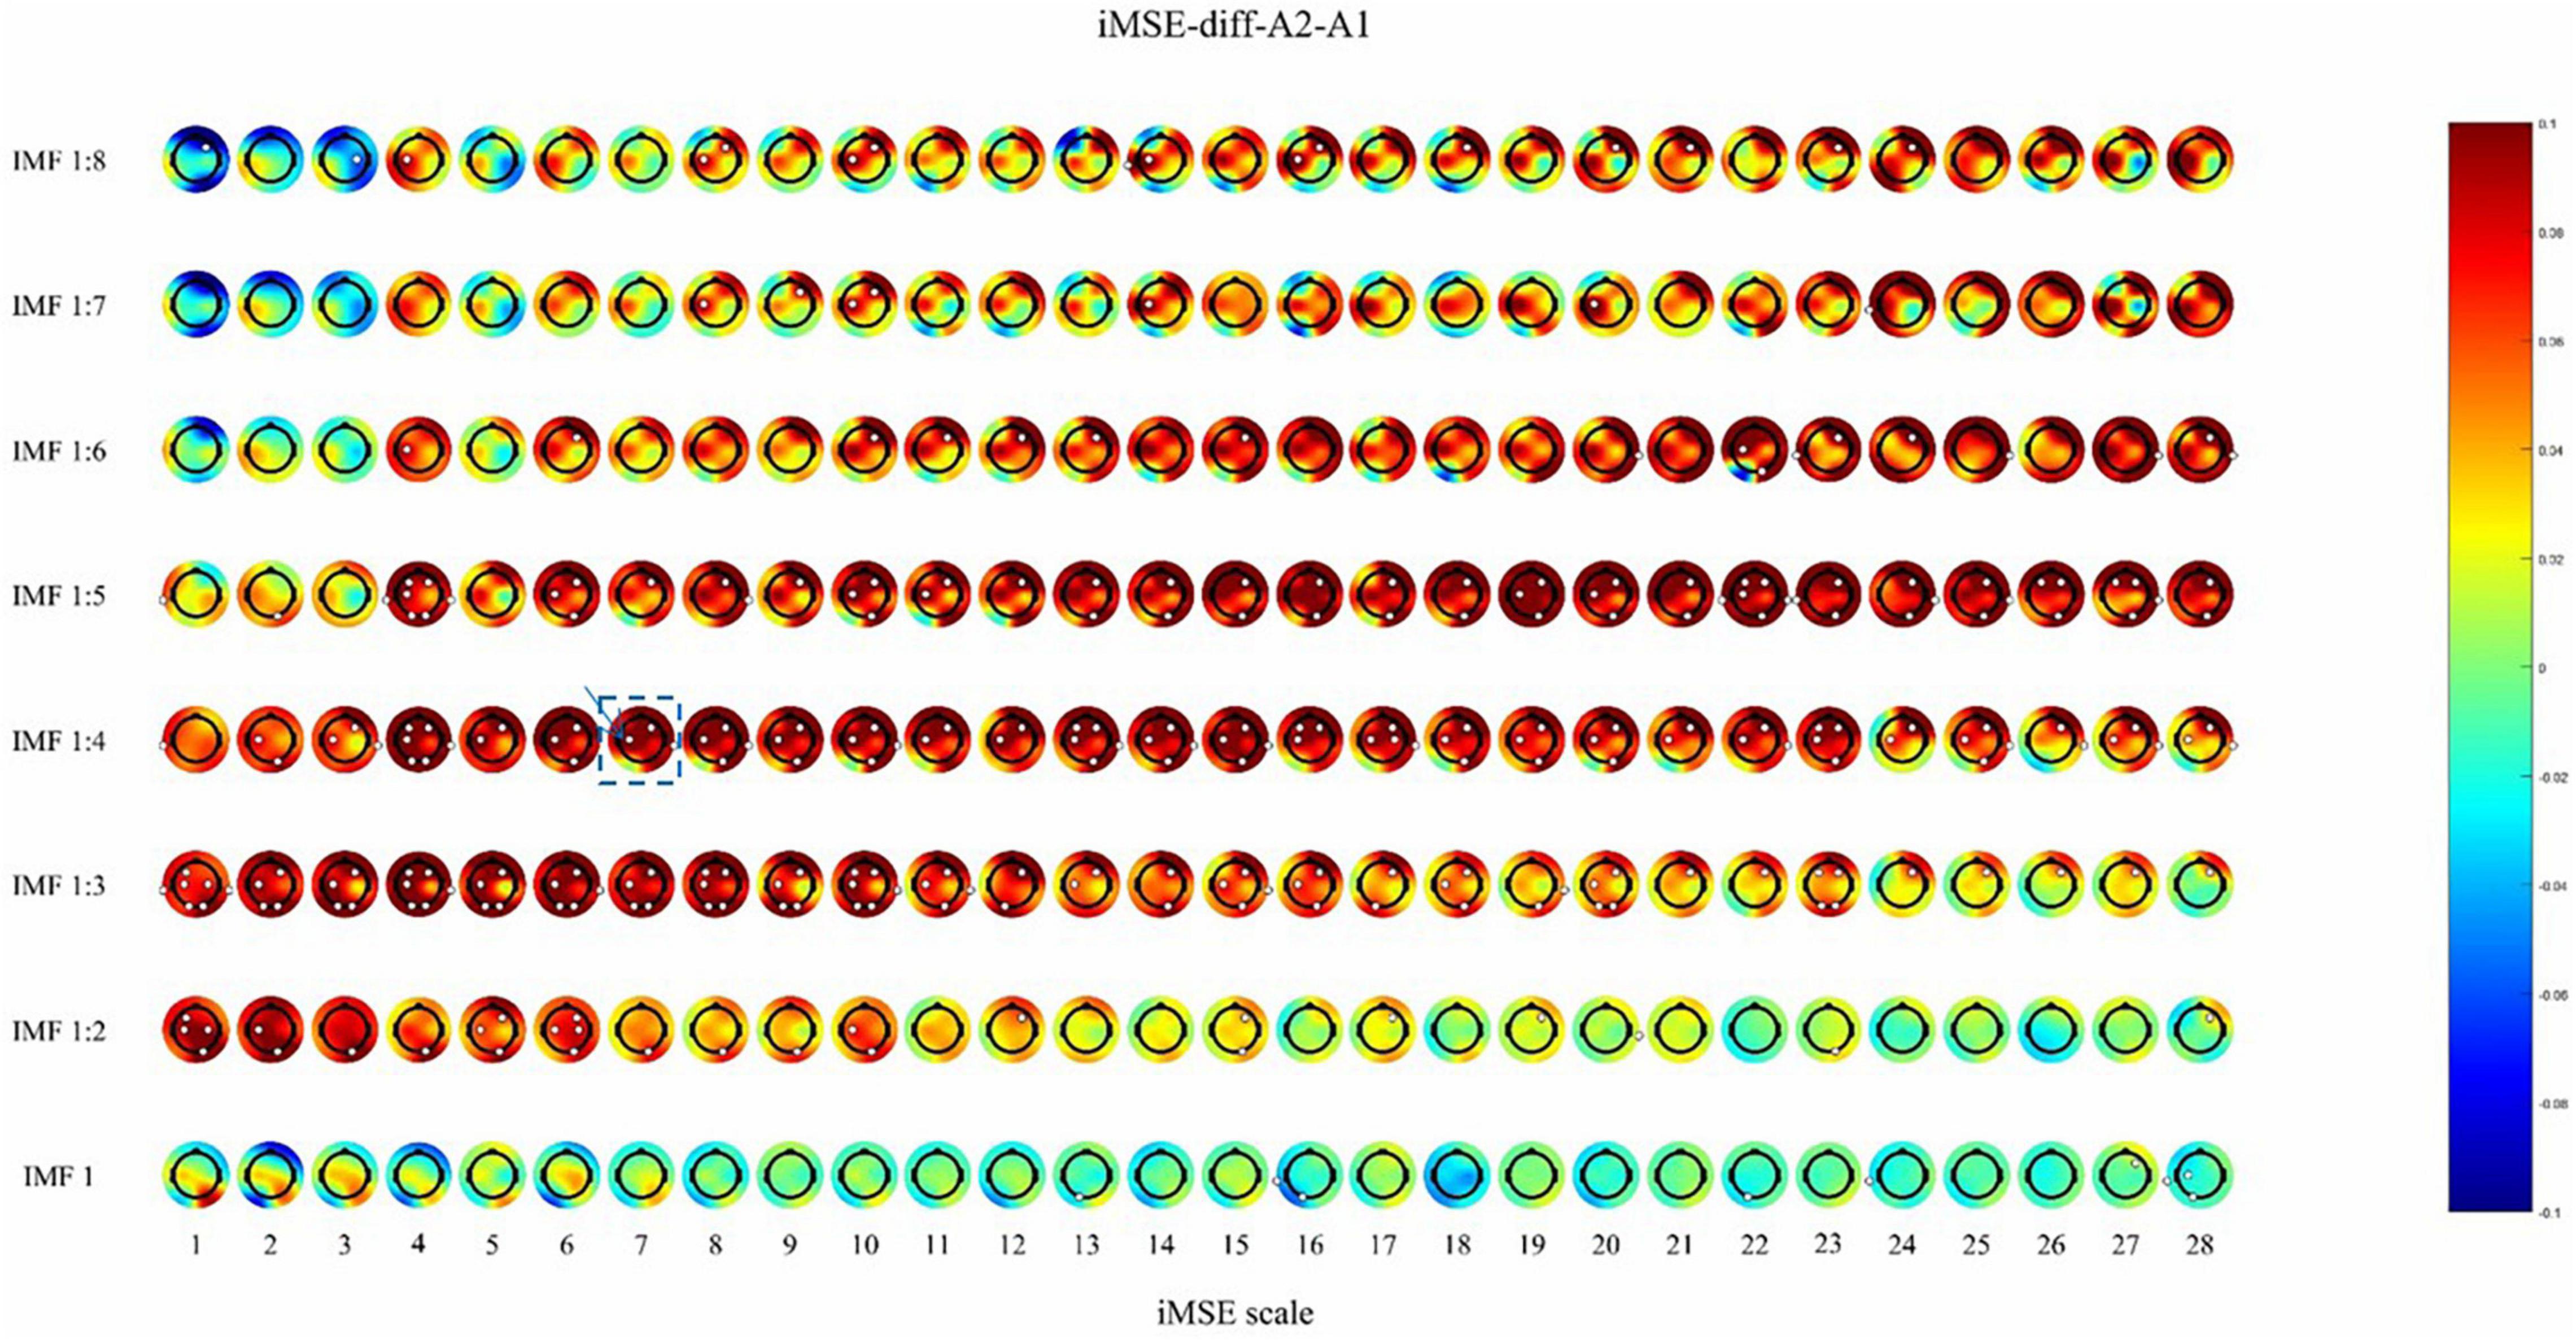
Figure 3. The difference before and after sham stimulation in iMSE for REM stage. Positive values indicate increased iMSE after stimulation. The small white dots indicate significant differences (p < 0.05).
Recruitment
An interim analysis was performed because of slow accrual. We are still recruiting new subjects for later stratification analysis.
Sleep Structure and Measuring Scale Assessing
There was no difference in the sleep structure before and after stimulation, including sleep efficiency, REM latency, sleep latency, total sleep time, and REM/N1/N2/N3 percentage (Table 2) in the active and sham groups.
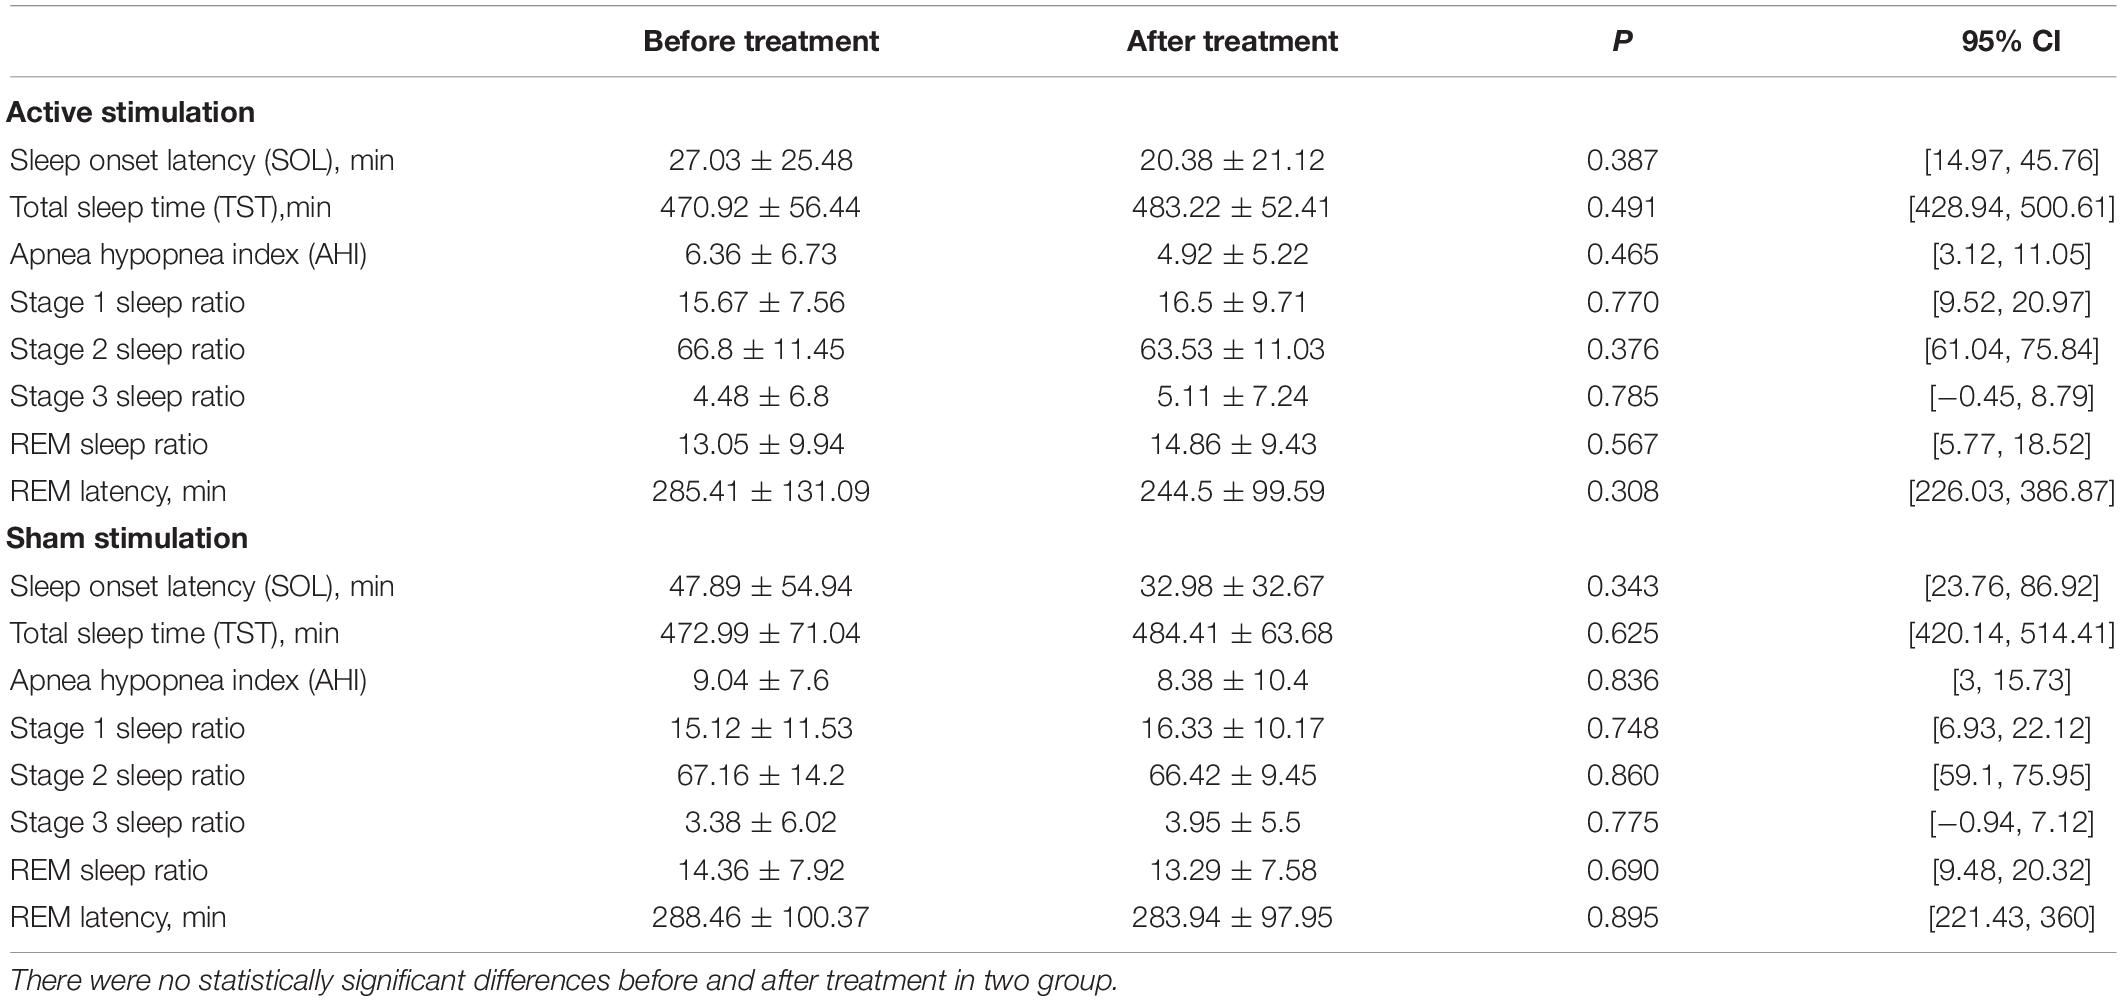
Table 2. Polysomnography (PSG) sleep structure before and after treatment in tDCS and sham group.
After the stimulation, there was a significant difference (p < 0.05) between the active and sham groups in the HRDS-24 early awakening scores. Active tDCS improves early awakening in depressed patients. In contrast, before the stimulation, there was no difference between the active and sham groups in the HRDS-24 early awakening scores (Table 3).
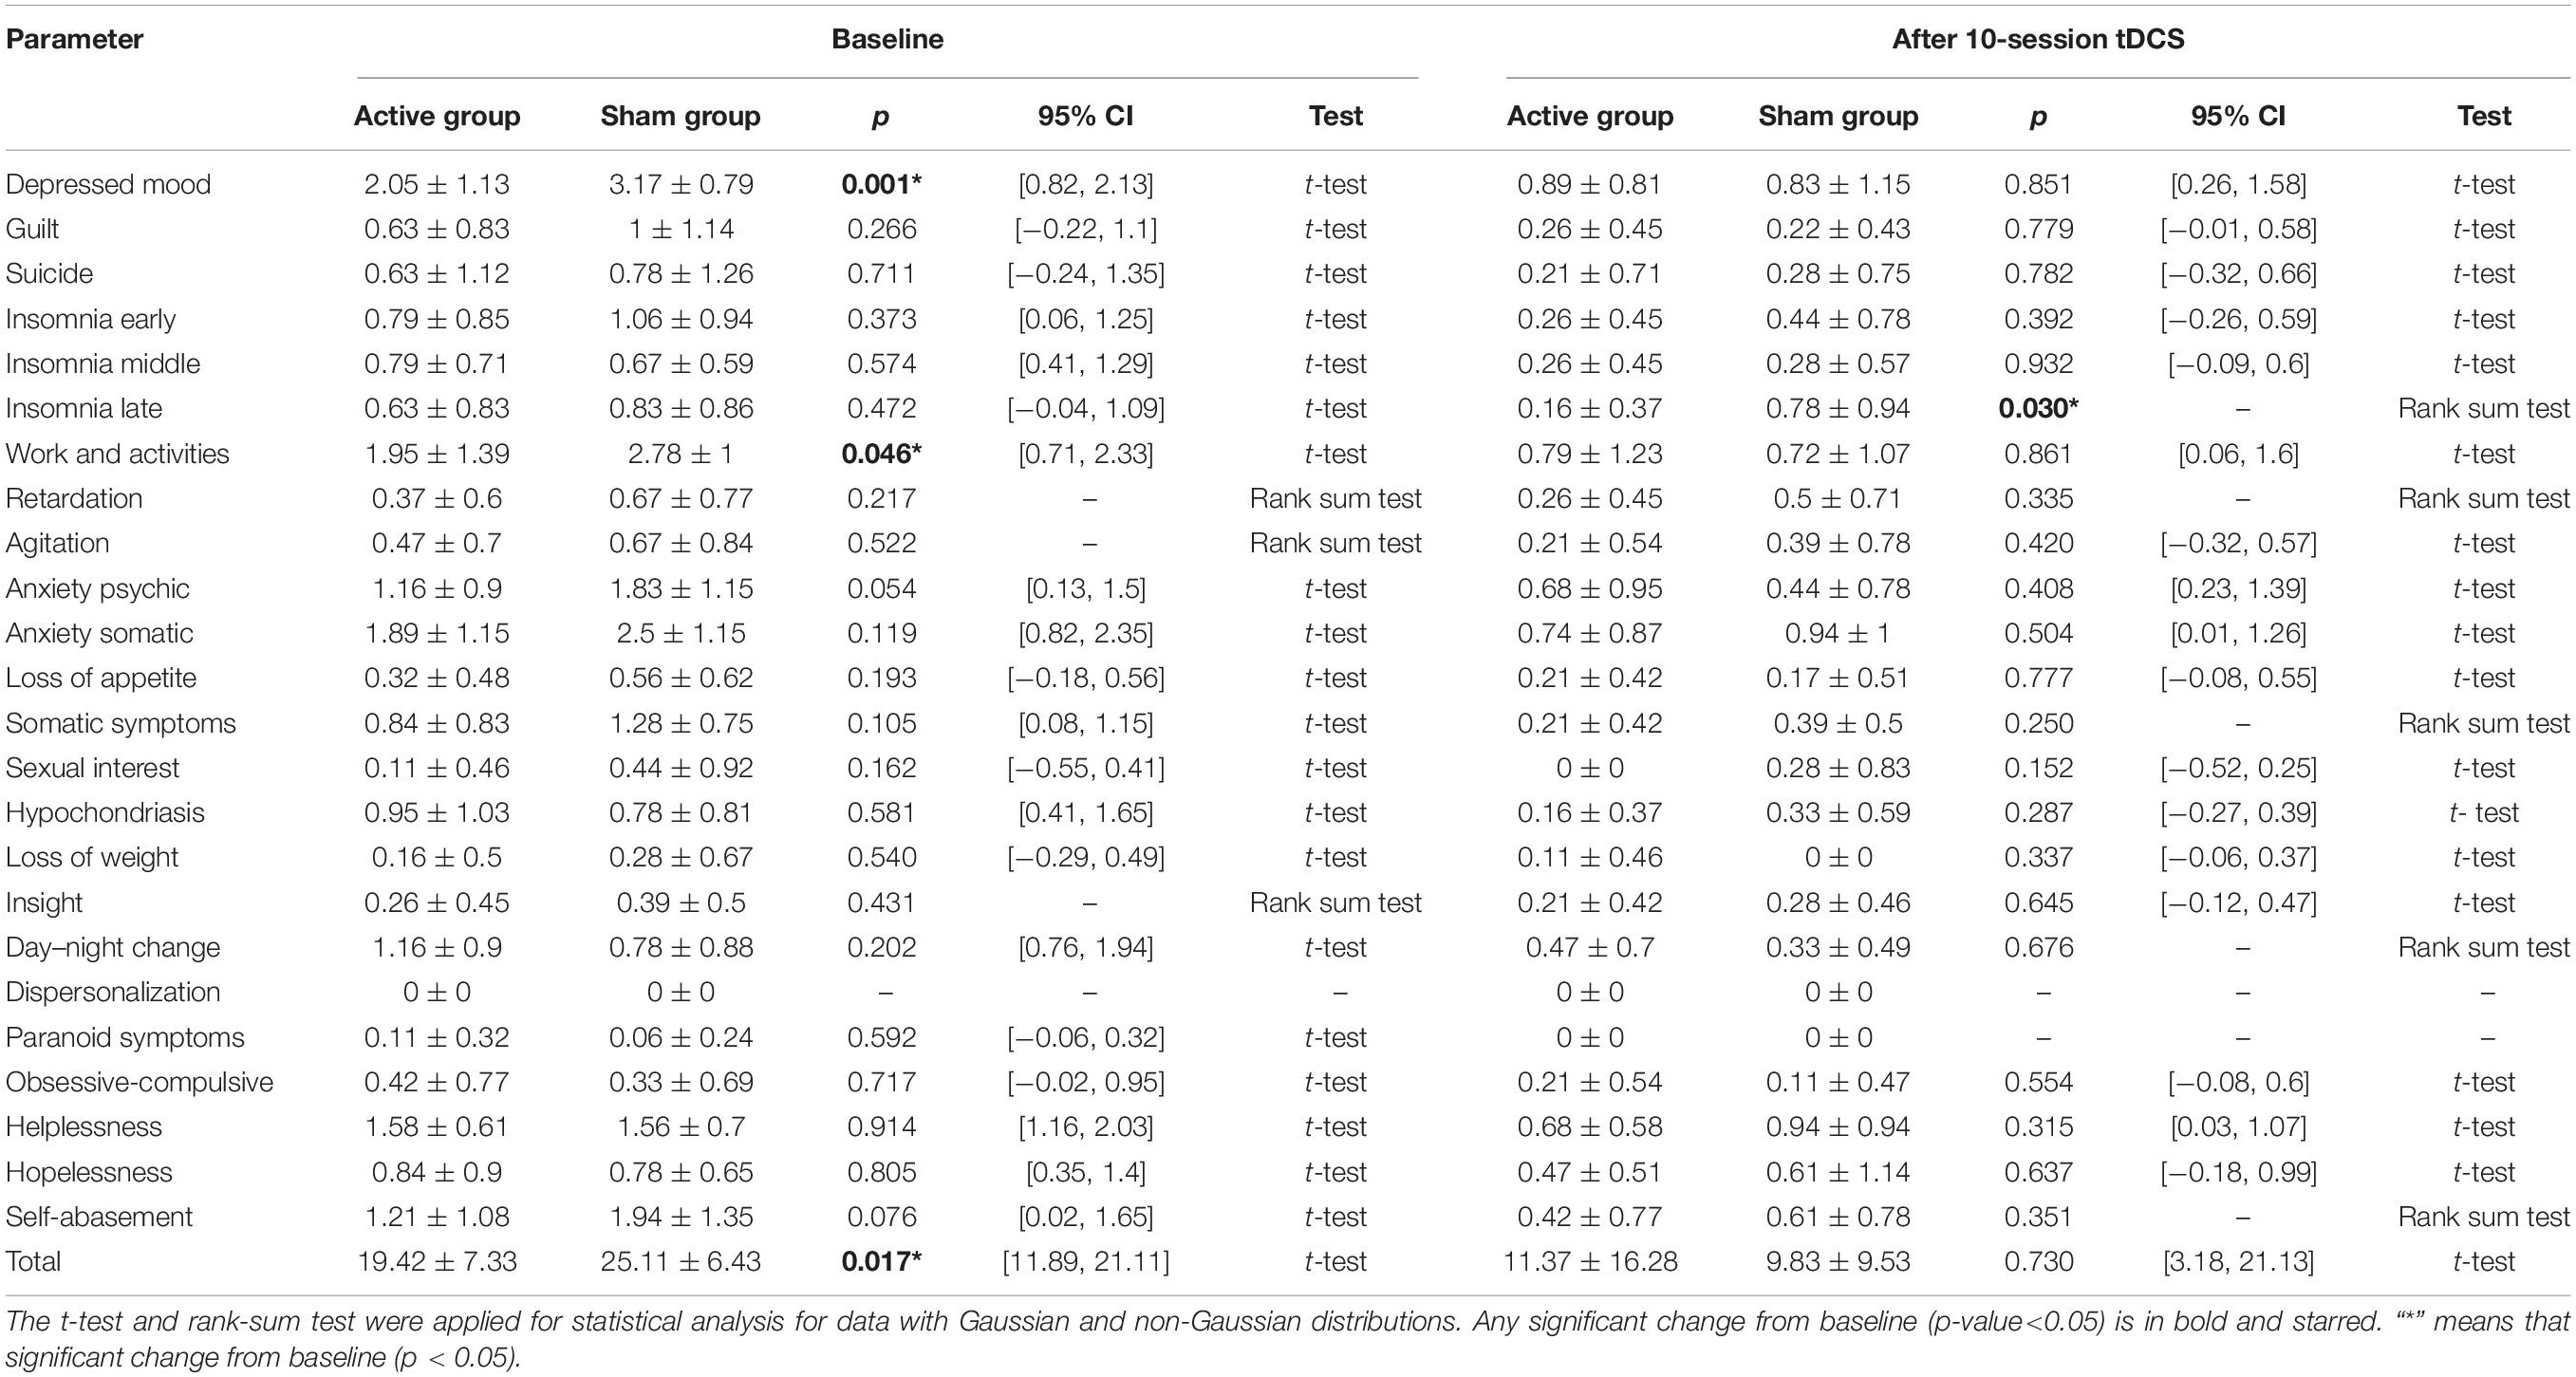
Table 3. Changes in hamilton depression rating scale total score and each factor score from baseline to after treatment.
After the stimulation, there were significant difference (P < 0.05) before and after stimulation, including depressed mood, early, middle, and late insomnia, work and activities, somatic anxiety, somatic symptoms, hypochondriasis, day-night change, helplessness, and self-abasement in active groups (Table 4). There were significant differences (P < 0.05) before and after stimulation, including depressed mood, guilt, early insomnia, work and activities, somatic anxiety, somatic symptoms, helplessness, self-abasement, and total scores in the sham group (Table 4).
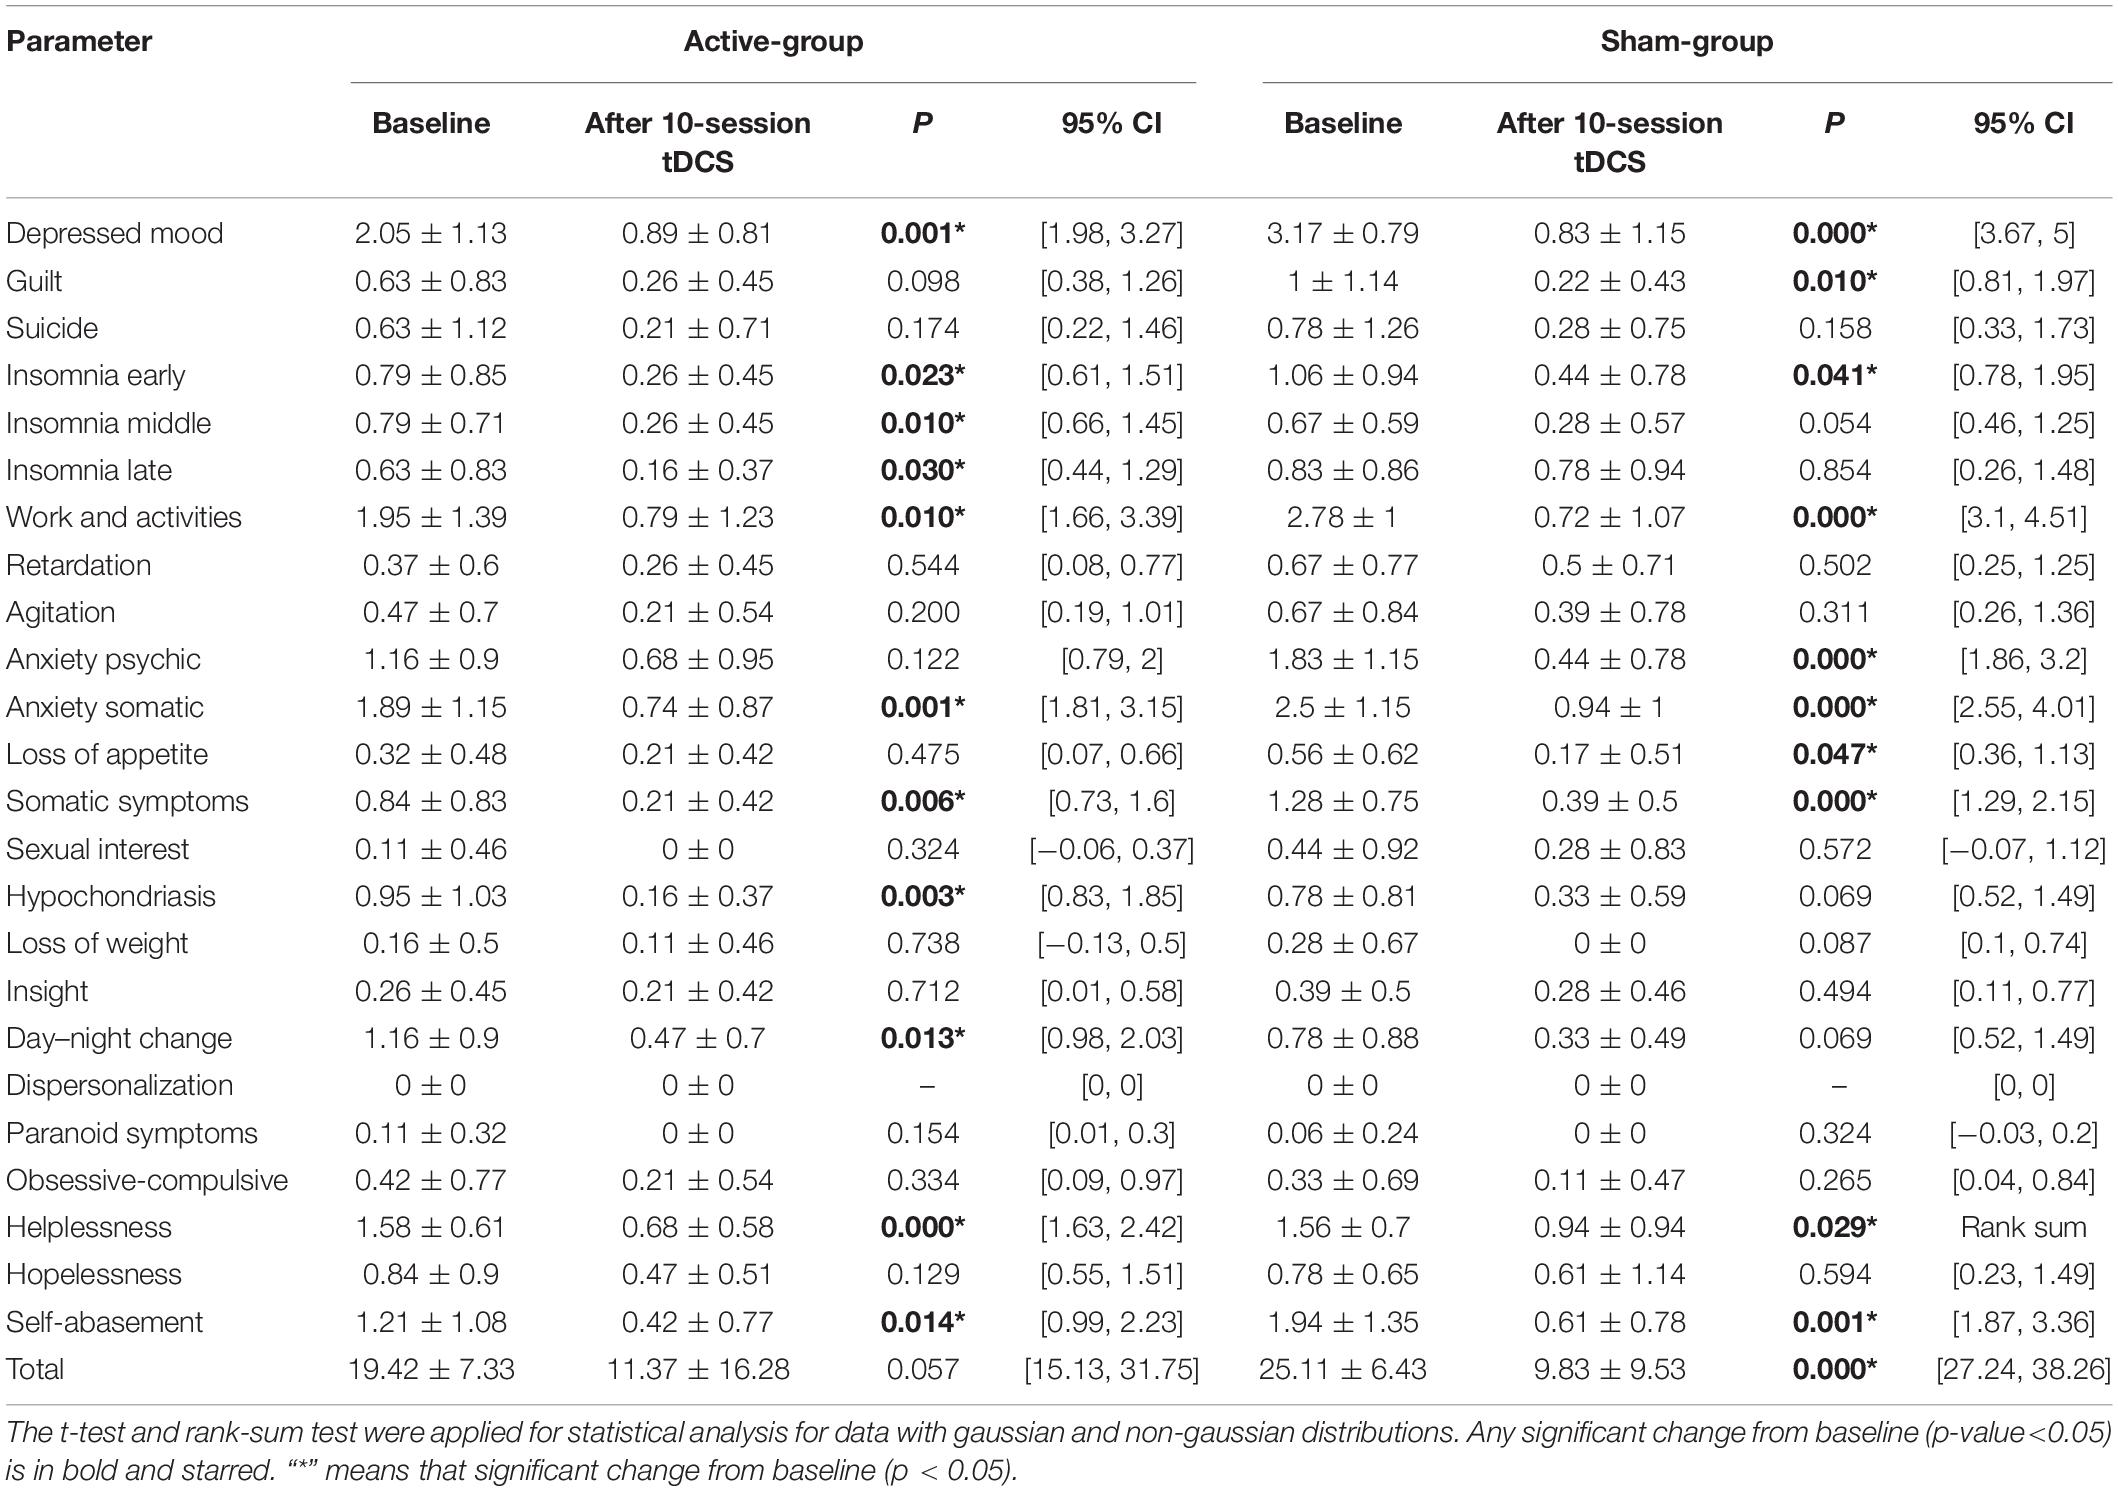
Table 4. Changes in hamilton depression rating scale total score and each factor score before and after treatment in active-group and sham-group.
Complexity
After active stimulation there was a significantly decreased iMSE compared with pre-treatment for the REM stage (Figure 2). In addition, after sham stimulation there was a significantly increased iMSE compared with pretreatment (Figure 3). In Figures 2, 3, the difference in EEG complexity is reflected by multiple dimensions with different channels, IMFs, and scales in the same figure. For a better demonstration of our findings, the typical result of a single channel, IMF, and scale is necessary, which have been marked in Figures 2, 3 with a red frame. Typically, the differences in variation trend are reflected in channel C3, IMF 1:4, and scale 7 (Figure 4).
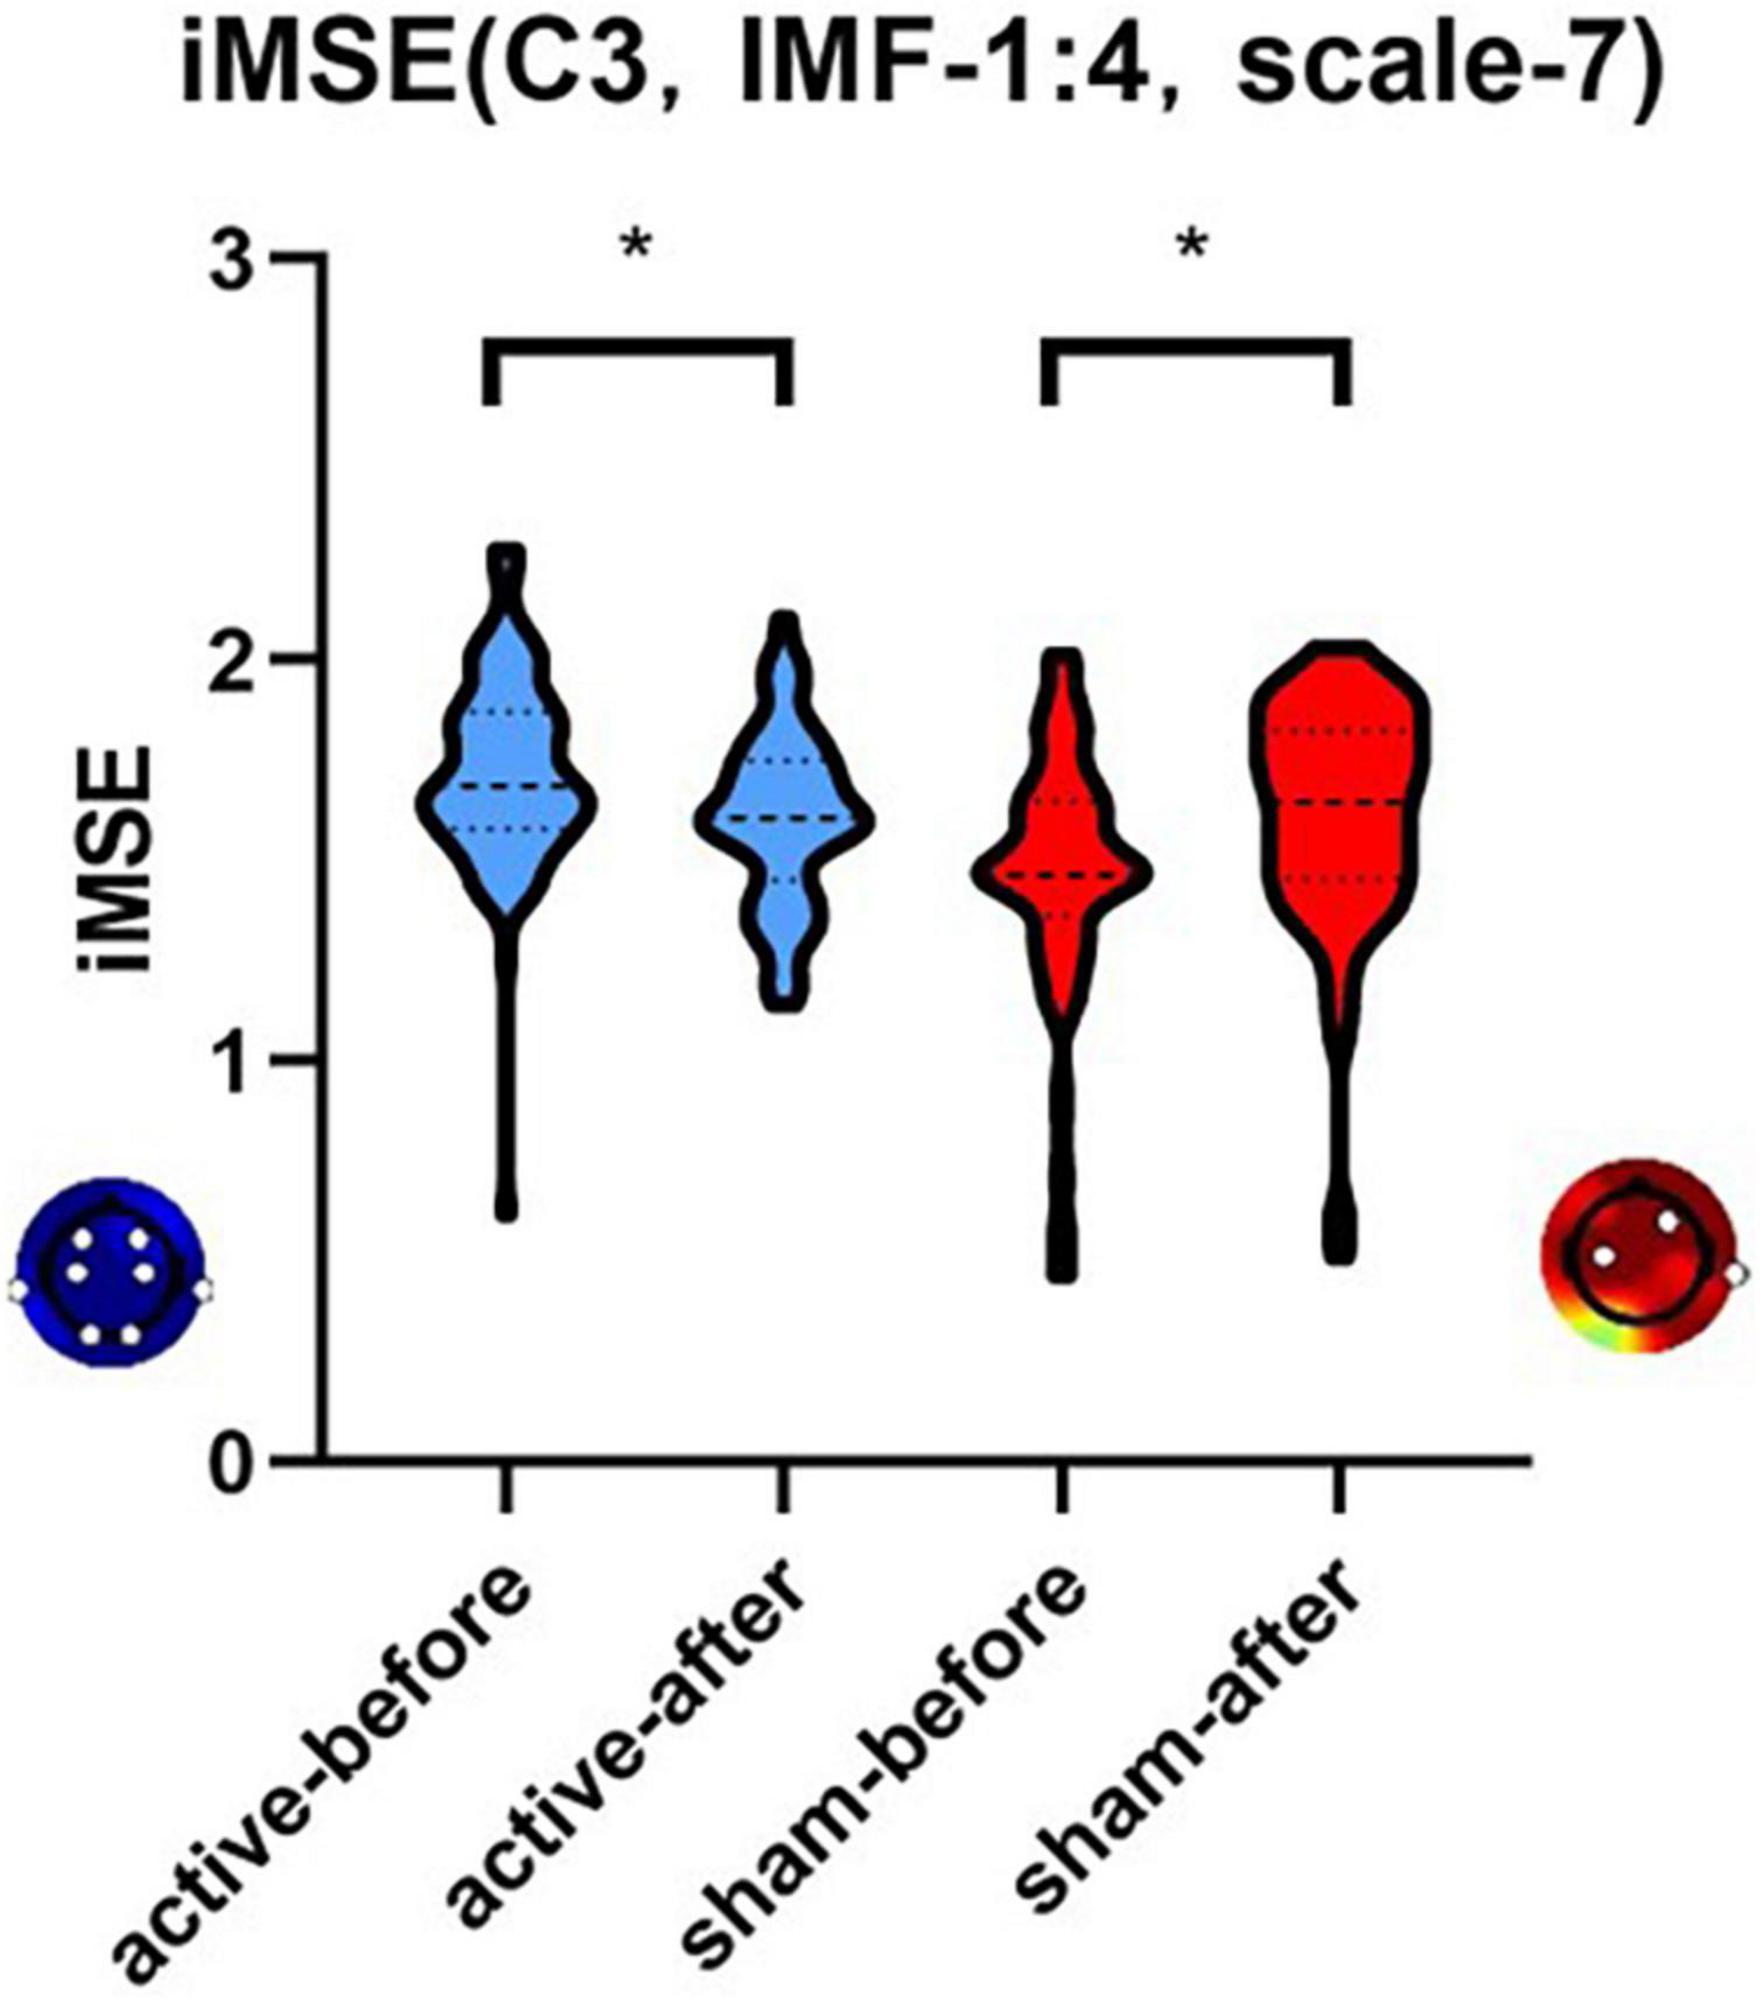
Figure 4. The differences in variation trend of iMSE in the case of channel C3, IMF 1:4, and scale 7. There was a different variation trend in the iMSE between the active and sham groups. “*” means that significant change from baseline (p < 0.05). Red colors represent increased EEG complexity and blue colors represent decreased EEG complexity.
Harms
Due to the lack of an appropriate scale for evaluating adverse effects of tDCS, only an open-ended survey was conducted in this study. Two patients in the active group complained of headaches. There were no corresponding reports in the sham group.
Discussion
In the current study iMSE was used for the first time to analyze the efficacy of tDCS in treating sleep EEG complexity in patients with depression. We showed that the complexity of REM EEG signals significantly decreased iMSE after tDCS active stimulation but the complexity of REM EEG signals significantly increased iMSE in tDCS sham group.
The typical sleep structure is divided into RME and NREM sleep; NREM sleep is divided into N1, N2, and N3 (40). The N3 sleep stage represents the deepest sleep, which is characterized on EEG by high amplitude slow delta waves, and therefore is frequently referred to delta sleep or slow wave sleep (SWS) (3). Several studies have shown that increased SWS during NREM improved sleep quality and enhances memory consolidation (41). SWS reduction is closely related to anxiety and depression (42).
Funk et al. showed that slow waves also occurred during REM (43). A study involving the EEG microstructure of REM sleep divided REM sleep into phasic and tonic REM (43, 44). Phasic REM is characterized by SWS, and EEG frequency is mainly in the delta-theta range between 2 and 8 Hz, while the EEG frequency of tonic REM sleep is mainly in gamma >32 Hz. Based on sleep EEG analysis, increased theta activity decreased EEG complexity (45). Studies on the sleep mechanism showed that increased theta activity contributed to enhancing emotional memory, which might be the sleep-related mechanism underlying tDCS in improving depression (46). In 2016 Mariani et al. (47) reported an inverse relationship between nighttime sleep quality and EEG complexity. Terzano et al. (48) found a negative correlation between sleep EEG complexity and deep sleep.
Entropy is a common non-linear feature of EEG that indicates the complexity of the EEG signal. Typically, the high complexity of sleep EEG reveals poor sleep quality. As one of the methods to measure EEG complexity, MSE has been used in relevant clinical studies. In 2010 Takahashi et al. (49) used MSE to measure cortical abnormalities and intervention effects in schizophrenia. In 2013 Okazaki et al. (50) used MSE to analyze EEG before and after electroconvulsive therapy for depression. The EEG complexity of all patients decreased after ECT treatment. In 2015, Kuo et al. (51). evaluated the sleep quality of 32 adults based on the sleep EEG MSE. Kuo et al. (51) reported that the average MSE values in the poor sleep efficiency group was higher than the good efficiency group. In our work, iMSE was applied, and we showed that REM sleep EEG complexity decreased during active tDCS stimulation, revealing that iMSE is a sensitive measure of sleep EEG complexity.
The iMSE was applied in this study fit for non-stationary and non-linear EEG signals. We found that EEG complexity decreased significantly during REM in patients with depression after active tDCS treatment, but increased in patients with sham tDCS treatment. The increase in EEG complexity during the REM period in the control group may have been related to antidepressant treatment. The common point of different antidepressant actions involved positive modulation of 5-HT and NE systems in the central nervous system. These neurotransmitters, mainly derived from the dorsal raphe and LC, respectively, inhibit cholinergic REM-on neurons in the LDT/PPT and lead to REM-off and arousal (52). This mechanism may account for the REM inhibitory effect of most antidepressants, which may cause sleep disorders and sleep fragmentation. For the sham-tDCS group, the reason for increased REM EEG complexity is likely related to antidepressants. At the same time, tDCS antagonizes the effect and improves sleep quality at night in patients with depression.
In the current study we showed that the HDRS-24 early awakening factor score in patients treated with active tDCS was significantly lower than the control group, suggesting that tDCS improved early awakening symptoms in patients with MDD. In both the treatment group and the control group, the scores of multiple factors of HAMD-24 decreased before and after treatment, which was considered to be related to the continued effect of the combined therapy. Meta-analyses suggest some efficacy of tDCS in the treatment of acute depression disorder with moderate effect size, and low efficacy in treatment-resistant depression (16). The subjects in this study were mainly inpatients with relatively severe depressive symptoms, and the addition of tDCS showed no significant effect on clinical manifestations of depression and the reduction of HDRS-24 score.
Previous studies have shown that tDCS treatment improved sleep quality with tDCS treatment between 9:00 a.m. and 12:00 a.m. during the day or night (53–56). The tDCS studies in healthy populations and patients with insomnia produced inconsistent results. Marshall et al. reported that tDCS in sleep time improved slow-wave sleep in healthy subjects (13). In 2019 Frase et al. showed that tDCS in sleep time increased nighttime arousal in patients with insomnia, which had been associated with a decrease in arousal threshold in insomniacs (15). By treating tDCS during the daytime, we not only made it more practical in the clinic, but also avoided the arousal threshold problem.
Our results suggested that daytime tDCS improved nighttime REM sleep EEG complexity in patients with MDD and iMSE, an effective and sensitive measure of assessing sleep quality by changes the EEG complexity during night sleep.
There were three major limitations of our work. First, the REM period was not separated as first, second, and third REM for analysis, which will be studied in the future. Second, after 2 weeks of fixed drug treatment, the intervention of drugs in treatment has been reduced as much as possible, however, the use of a single antidepressant treatment is challenging. The sample size shall be expanded continually to analyze drug influence in separate groups. Third, beside items of insomnia symptoms in HRDS-24, there was no information regarding self-reported sleep quality in this study, We will add the sleep self-rating scale in corollary study.
Data Availability Statement
The original contributions presented in the study are included in the article/supplementary material, further inquiries can be directed to the corresponding authors.
Ethics Statement
The studies involving human participants were reviewed and approved by the Ethics Committee of Suzhou Guangji Hospital. The patients/participants provided their written informed consent to participate in this study.
Author Contributions
ZL mainly wrote this manuscript. XuZ and LF completed the evaluation of the experimental scale. YZ, WP, MY, YY, XF, and GL collected clinical data. YL and SG performed PSG analysis. NH was the originator of iMSE analysis methods and guided the explanation of the rationality of the methods. XiZ, XD, and RC helped in writing the manuscript. All authors have read and approved the final manuscript.
Funding
This work was supported by Gusu health personnel training program (SWS2019070). This funding was used to analyze data and write the manuscript. This work also supported by Jiangsu Province social development project (BE2020764) collected data pay for the Polysomnography. This work also supported by the Discipline Construction Program of the Second Affiliated Hospital of Soochow University (XKTJ-TD202003); Jiangsu Province “333 Project” scientific research project (BRA2020120); Suzhou Municipal Health and Family Planning Commission Research Project (KJXW2019049) for clinical data collection. The Nanjing New Research and Development Institutions Record (2019SX00100484-201921083) provided funding for iMSE data processing.
Conflict of Interest
The authors declare that the research was conducted in the absence of any commercial or financial relationships that could be construed as a potential conflict of interest.
Publisher’s Note
All claims expressed in this article are solely those of the authors and do not necessarily represent those of their affiliated organizations, or those of the publisher, the editors and the reviewers. Any product that may be evaluated in this article, or claim that may be made by its manufacturer, is not guaranteed or endorsed by the publisher.
Acknowledgments
We thank Zhuang Yue from Peking University for supporting data analysis.
References
1. Kessler RC, Berglund P, Demler O, Jin R, Koretz D, Merikangas KR, et al. The epidemiology of major depressive disorder: results from the National comorbidity survey replication (NCS-R). JAMA. (2003) 289:3095–105. doi: 10.1001/jama.289.23.3095
2. Ronold EH, Schmid MT, Oedegaard KJ, Hammar Å. A longitudinal 5-year follow-up study of cognitive function after first episode major depressive disorder: exploring state, scar and trait effects. Front Psychiatry. (2020) 11:575867. doi: 10.3389/fpsyt.2020.575867
3. Wichniak A, Wierzbicka A, Jernajczyk W. Sleep as a biomarker for depression. Int Rev Psychiatry. (2013) 25:632–45. doi: 10.3109/09540261.2013.812067
4. Stahl SM. Essential Psychopharmacology: Neuroscientific Basis and Practical Applications. New York, NY: Cambridge University Press (2000).
5. Baglioni C, Nanovska S, Regen W, Spiegelhalder K, Feige B, Nissen C, et al. Sleep and mental disorders: a meta-analysis of polysomnographic research. Psychol Bull. (2016) 142:969. doi: 10.1037/bul0000053
6. Jones D, Gershon S, Sitaram N, Keshavan M. Sleep and depression. Psychopathology. (1987) 20:20–31.
7. Keefe RS. The longitudinal course of cognitive impairment in schizophrenia: an examination of data from premorbid through posttreatment phases of illness. J Clin Psychiatry. (2014) 75:0–0. doi: 10.4088/JCP.13065su1.02
9. Dunlop K, Hanlon CA, Downar J. Noninvasive brain stimulation treatments for addiction and major depression. Ann N Y Acad Sci. (2017) 1394:31. doi: 10.1111/nyas.12985
10. Wichniak A, Wierzbicka A, Walęcka M, Jernajczyk W. Effects of antidepressants on sleep. Curr Psychiatry Rep. (2017) 19:63.
11. Krishnan C, Santos L, Peterson MD, Ehinger M. Safety of noninvasive brain stimulation in children and adolescents. Brain Stimul. (2015) 8:76–87. doi: 10.1016/j.brs.2014.10.012
12. Brunoni AR, Nitsche MA, Bolognini N, Bikson M, Wagner T, Merabet L, et al. Clinical research with transcranial direct current stimulation (tDCS): challenges and future directions. Brain Stimul. (2012) 5:175–95. doi: 10.1016/j.brs.2011.03.002
13. Marshall L, Helgadóttir H, Mölle M, Born J. Boosting slow oscillations during sleep potentiates memory. Nature. (2006) 444:610–3. doi: 10.1038/nature05278
14. Charest J, Marois A, Bastien CH. Can a tDCS treatment enhance subjective and objective sleep among student-athletes? J Am Coll Health. (2021) 69:378–89. doi: 10.1080/07448481.2019.1679152
15. Frase L, Selhausen P, Krone L, Tsodor S, Jahn F, Feige B, et al. Differential effects of bifrontal tDCS on arousal and sleep duration in insomnia patients and healthy controls. Brain Stimul. (2019) 12:674–83. doi: 10.1016/j.brs.2019.01.001
16. Palm U, Hasan A, Strube W, Padberg F. tDCS for the treatment of depression: a comprehensive review. Eur Arch Psychiatry Clin Neurosci. (2016) 266:681–94. doi: 10.1007/s00406-016-0674-9
17. Fregni F, Boggio PS, Nitsche MA, Rigonatti SP, Pascual-Leone A. Cognitive effects of repeated sessions of transcranial direct current stimulation in patients with depression. Depress Anxiety. (2006) 23:482–4. doi: 10.1002/da.20201
18. Rigonatti SP, Boggio PS, Myczkowski ML, Otta E, Fiquer JT, Ribeiro RB, et al. Transcranial direct stimulation and fluoxetine for the treatment of depression. Eur Psychiatry. (2008) 23:74–6.
19. Sampaio-Junior B, Tortella G, Borrione L, Moffa AH, Machado-Vieira R, Cretaz E, et al. Efficacy and safety of transcranial direct current stimulation as an add-on treatment for bipolar depression: a randomized clinical trial. JAMA Psychiatry. (2018) 75:158–66. doi: 10.1001/jamapsychiatry.2017.4040
20. Kurzeck AK, Dechantsreiter E, Wilkening A, Kumpf U, Nenov-Matt T, Padberg F, et al. Transcranial direct current stimulation (tDCS) for depression during pregnancy: results from an open-label pilot study. Brain Sci. (2021) 11:947. doi: 10.3390/brainsci11070947
21. Kaster TS, Daskalakis ZJ, Noda Y, Knyahnytska Y, Downar J, Rajji TK, et al. Efficacy, tolerability, and cognitive effects of deep transcranial magnetic stimulation for late-life depression: a prospective randomized controlled trial. Neuropsychopharmacology. (2018) 43:2231–38. doi: 10.1038/s41386-018-0121-x
22. de Aguiar Neto FS, Rosa JLG. Depression biomarkers using non-invasive EEG: a review. Neurosci Biobehav Rev. (2019) 105:83–93. doi: 10.1016/j.neubiorev.2019.07.021
23. Wu L, Wang X-Q, Yang Y, Dong T-F, Lei L, Cheng Q-Q, et al. Spatio-temporal dynamics of EEG features during sleep in major depressive disorder after treatment with escitalopram: a pilot study. BMC Psychiatry. (2020) 20:124. doi: 10.1186/s12888-020-02519-x
24. Janjarasjitt S, Scher M, Loparo K. Nonlinear dynamical analysis of the neonatal EEG time series: the relationship between neurodevelopment and complexity. Clin Neurophysiol. (2008) 119:822–36. doi: 10.1016/j.clinph.2007.11.012
25. Ferri R, Parrino L, Smerieri A, Terzano MG, Elia M, Musumeci SA, et al. Non-linear EEG measures during sleep: effects of the different sleep stages and cyclic alternating pattern. Int J Psychophysiol. (2002) 43:273–86. doi: 10.1016/s0167-8760(02)00006-5
26. Janjarasjitt S, Scher M, Loparo K. Nonlinear dynamical analysis of the neonatal EEG time series: the relationship between sleep state and complexity. Clin Neurophysiol. (2008) 119:1812–23. doi: 10.1016/j.clinph.2008.03.024
27. Zhang D, Ding H, Liu Y, Zhou C, Ding H, Ye D. Neurodevelopment in newborns: a sample entropy analysis of electroencephalogram. Physiol Meas. (2009) 30:491. doi: 10.1088/0967-3334/30/5/006
28. Chung C-C, Kang J-H, Yuan R-Y, Wu D, Chen C-C, Chi N-F, et al. Multiscale entropy analysis of electroencephalography during sleep in patients with Parkinson disease. Clin EEG Neurosci. (2013) 44:221–6. doi: 10.1177/1550059412475066
29. Amoud H, Snoussi H, Hewson D, Doussot M, Duchene J. Intrinsic mode entropy for nonlinear discriminant analysis. IEEE Signal Process Lett. (2007) 14:297–300. doi: 10.1109/lsp.2006.888089
30. Agboada D, Mosayebi-Samani M, Kuo M-F, Nitsche MA. Induction of long-term potentiation-like plasticity in the primary motor cortex with repeated anodal transcranial direct current stimulation–better effects with intensified protocols? Brain Stimul. (2020) 13:987–97. doi: 10.1016/j.brs.2020.04.009
31. Alonzo A, Aaronson S, Bikson M, Husain M, Lisanby S, Martin D, et al. Study design and methodology for a multicentre, randomised controlled trial of transcranial direct current stimulation as a treatment for unipolar and bipolar depression. Contemp Clin Trials. (2016) 51:65–71. doi: 10.1016/j.cct.2016.10.002
32. Markun LC, Sampat A. Clinician-focused overview and developments in polysomnography. Curr Sleep Med Rep. (2020) 6:309–21. doi: 10.1007/s40675-020-00197-5
33. Berry RB, Brooks R, Gamaldo CE, Harding SM, Marcus C, Vaughn BV. The AASM Manual for the Scoring of Sleep and Associated Events. Rules, Terminology and Technical Specifications. (Vol. 176). Darien, IL: American Academy of Sleep Medicine (2012).
34. ur Rehman N, Park C, Huang NE, Mandic DP. EMD via MEMD: multivariate noise-aided computation of standard EMD. Adv Adap Data Analy. (2013) 5:1350007. doi: 10.1142/s1793536913500076
35. Wang Y-H, Yeh C-H, Young H-WV, Hu K, Lo M-T. On the computational complexity of the empirical mode decomposition algorithm. Phys A Stat Mech Appl. (2014) 400:159–67. doi: 10.1016/j.physa.2014.01.020
36. Shah N. Quantification of Regularity in RR-Interval Time Series using Approximate Entropy, Sample Entropy, and Multi-Scale Entropy. M.S Thesis. Newark, NJ: New Jersey Institute of Technology (NJIT) Digital commons (2005).
37. Al-Kaysi AM, Al-Ani A, Loo CK, Powell TY, Martin DM, Breakspear M, et al. Predicting tDCS treatment outcomes of patients with major depressive disorder using automated EEG classification. J Affect Disord. (2017) 208:597–603. doi: 10.1016/j.jad.2016.10.021
38. Shahsavar Y, Ghoshuni M, Talaei A. Quantifying clinical improvements in patients with depression under the treatment of transcranial direct current stimulation using event related potentials. Australas Phys Eng Sci Med. (2018) 41:973–83. doi: 10.1007/s13246-018-0696-x
39. Liu A, Bryant A, Jefferson A, Friedman D, Minhas P, Barnard S, et al. Exploring the efficacy of a 5-day course of transcranial direct current stimulation (TDCS) on depression and memory function in patients with well-controlled temporal lobe epilepsy. Epilepsy Behav. (2016) 55:11–20. doi: 10.1016/j.yebeh.2015.10.032
40. Walker MP. The role of sleep in cognition and emotion. Ann N Y Acad Sci. (2009) 1156:168–97. doi: 10.1111/j.1749-6632.2009.04416.x
41. Zhang Y, Gruber R. Focus: attention science: can slow-wave sleep enhancement improve memory? A review of current approaches and cognitive outcomes. Yale J Biol Med. (2019) 92:63–80.
42. Dijk D-J. Slow-wave sleep deficiency and enhancement: implications for insomnia and its management. World J Biol Psychiatry. (2010) 11:22–8. doi: 10.3109/15622971003637645
43. Funk CM, Honjoh S, Rodriguez AV, Cirelli C, Tononi G. Local slow waves in superficial layers of primary cortical areas during REM sleep. Curr Biol. (2016) 26:396–403. doi: 10.1016/j.cub.2015.11.062
44. Baird B, Castelnovo A, Riedner BA, Lutz A, Ferrarelli F, Boly M, et al. Human rapid eye movement sleep shows local increases in low-frequency oscillations and global decreases in high-frequency oscillations compared to resting wakefulness. eNeuro. (2018) 5:ENEURO.293–218. doi: 10.1523/ENEURO.0293-18.2018
45. Simor P, van der Wijk G, Nobili L, Peigneux P. The microstructure of REM sleep: why phasic and tonic? Sleep Med Rev. (2020) 52:101305. doi: 10.1016/j.smrv.2020.101305
46. Riemann D, Krone LB, Wulff K, Nissen C. Sleep, insomnia, and depression. Neuropsychopharmacology. (2020) 45:74–89. doi: 10.1038/s41386-019-0411-y
47. Mariani S, Borges AF, Henriques T, Thomas RJ, Leistedt SJ, Linkowski P, et al. Analysis of the sleep EEG in the complexity domain. Proceedings of the 2016 38th Annual International Conference of the IEEE Engineering in Medicine and Biology Society (EMBC). Orlando, FL: IEEE (2016). p. 6429–32. doi: 10.1109/EMBC.2016.7592200
48. Terzano MG, Parrino L. Clinical applications of cyclic alternating pattern. Physiol Behav. (1993) 54:807–13. doi: 10.1016/0031-9384(93)90096-x
49. Takahashi T, Cho RY, Mizuno T, Kikuchi M, Murata T, Takahashi K, et al. Antipsychotics reverse abnormal EEG complexity in drug-naive schizophrenia: a multiscale entropy analysis. Neuroimage. (2010) 51:173–82. doi: 10.1016/j.neuroimage.2010.02.009
50. Okazaki R, Takahashi T, Ueno K, Takahashi K, Higashima M, Wada Y. Effects of electroconvulsive therapy on neural complexity in patients with depression: report of three cases. J Affect Disord. (2013) 150:389–92. doi: 10.1016/j.jad.2013.04.029
51. Kuo C-E, Liang S-F, Shih Y-H, Shaw F-Z. Evaluating the sleep quality using multiscale entropy analysis. Proceedings of the 1st Global Conference on Biomedical Engineering & 9th Asian-Pacific Conference on Medical and Biological Engineering. Tainan: Springer (2015). p. 166–9. doi: 10.3389/fnins.2018.00809
52. Wang Y-Q, Li R, Zhang M-Q, Zhang Z, Qu W-M, Huang Z-L. The neurobiological mechanisms and treatments of REM sleep disturbances in depression. Curr Neuropharmacol. (2015) 13:543–53. doi: 10.2174/1570159x13666150310002540
53. Zhou Q, Yu C, Yu H, Zhang Y, Liu Z, Hu Z, et al. The effects of repeated transcranial direct current stimulation on sleep quality and depression symptoms in patients with major depression and insomnia. Sleep Med. (2020) 70:17–26. doi: 10.1016/j.sleep.2020.02.003
54. Hadoush H, Al-Sharman A, Khalil H, Banihani SA, Al-Jarrah M. Sleep quality, depression, and quality of life after bilateral anodal transcranial direct current stimulation in patients with Parkinson’s disease. Med Sci Monit Basic Res. (2018) 24:198. doi: 10.12659/MSMBR.911411
55. Acler M, Bocci T, Valenti D, Turri M, Priori A, Bertolasi L. Transcranial direct current stimulation (tDCS) for sleep disturbances and fatigue in patients with post-polio syndrome. Restor Neurol Neurosci. (2013) 31:661–8. doi: 10.3233/RNN-130321
Keywords: depression, electroencephalogram, intrinsic multi-scale entropy, rapid eye movement, transcranial direct current stimulation, randomized, double-blinded, placebo-controlled trial
Citation: Li Z, Zhao X, Feng L, Zhao Y, Pan W, Liu Y, Yin M, Yue Y, Fang X, Liu G, Gao S, Zhang X, Huang NE, Du X and Chen R (2022) Can Daytime Transcranial Direct Current Stimulation Treatment Change the Sleep Electroencephalogram Complexity of REM Sleep in Depressed Patients? A Double-Blinded, Randomized, Placebo-Controlled Trial. Front. Psychiatry 13:851908. doi: 10.3389/fpsyt.2022.851908
Received: 10 January 2022; Accepted: 27 April 2022;
Published: 18 May 2022.
Edited by:
Bin Zhang, Southern Medical University, ChinaReviewed by:
Hsin-Chien Lee, Taipei Medical University, TaiwanXiangdong Tang, Sichuan University, China
Copyright © 2022 Li, Zhao, Feng, Zhao, Pan, Liu, Yin, Yue, Fang, Liu, Gao, Zhang, Huang, Du and Chen. This is an open-access article distributed under the terms of the Creative Commons Attribution License (CC BY). The use, distribution or reproduction in other forums is permitted, provided the original author(s) and the copyright owner(s) are credited and that the original publication in this journal is cited, in accordance with accepted academic practice. No use, distribution or reproduction is permitted which does not comply with these terms.
*Correspondence: Rui Chen, chenruigood@126.com; Xiangdong Du, xiangdong-du@163.com
†These authors share first authorship