Eruption and Interplanetary Evolution of a Stealthy Streamer-Blowout CME Observed by PSP at ∼0.5 AU
 Sanchita Pal1*
  Benjamin J. Lynch2
  Simon W. Good1
  Erika Palmerio3
  Eleanna Asvestari1
  Jens Pomoell1
  Michael L. Stevens4
  Emilia K. J. Kilpua1
- 1Department of Physics, University of Helsinki, Helsinki, Finland
- 2Space Sciences Laboratory, University of CA–Berkeley, Berkeley, CA, United States
- 3Predictive Science Inc., San Diego, CA, United States
- 4Smithsonian Astrophysical Observatory, Cambridge, MA, United States
Streamer-blowout coronal mass ejections (SBO-CMEs) are the dominant CME population during solar minimum. Although they are typically slow and lack clear low-coronal signatures, they can cause geomagnetic storms. With the aid of extrapolated coronal fields and remote observations of the off-limb low corona, we study the initiation of an SBO-CME preceded by consecutive CME eruptions consistent with a multi-stage sympathetic breakout scenario. From inner-heliospheric Parker Solar Probe (PSP) observations, it is evident that the SBO-CME is interacting with the heliospheric magnetic field and plasma sheet structures draped about the CME flux rope. We estimate that 18 ± 11% of the CME’s azimuthal magnetic flux has been eroded through magnetic reconnection and that this erosion began after a heliospheric distance of ∼0.35 AU from the Sun was reached. This observational study has important implications for understanding the initiation of SBO-CMEs and their interaction with the heliospheric surroundings.
1 Introduction
Coronal mass ejections (CMEs) are huge expulsions of magnetised solar plasma into interplanetary space. They were first discovered in the early 1970s (Tousey, 1973; Gosling et al., 1974) and initially assumed to be always associated with solar flares and/or filaments. Based on improved coronagraphic and multi-wavelength low-coronal observations, a class of CMEs emerging from streamers having signatures of flux ropes (FRs) was identified and named as “streamer-blowout” (hereafter SBO; Sheeley et al., 1982; Vourlidas et al., 2002; Vourlidas and Webb, 2018) CMEs (SBO-CMEs). Their evacuation may take hours to days and their location mostly follow the tilt of the heliospheric current sheet (HCS; Vourlidas and Webb, 2018)—a boundary between open and oppositely directed heliospheric field lines (Smith, 2001). Having no direct association with solar active regions, flares, and/or filaments, SBO-CMEs often lack classic low-coronal signatures (Robbrecht et al., 2009; Ma et al., 2010; Kilpua et al., 2014; Lynch et al., 2016) and are hence characterised as “stealth CMEs” (Robbrecht et al., 2009; Howard and Harrison, 2013). Recent high-resolution, multi-wavelength, and multi-viewpoint coronal observations have revealed weak low-coronal dynamics associated with stealth CMEs, in some cases enabling study of their formation and lift-off (Korreck et al., 2020; Palmerio et al., 2021b; O’Kane et al., 2021). Stealth CMEs may also cause significant magnetic storms at Earth that are problematic for space weather forecasting (Nitta et al., 2021).
CMEs are preceded by a gradual accumulation of free magnetic energy and subsequent triggering of plasma instabilities in the energized magnetic structure. The accumulated free energy can power consecutive sympathetic eruptions in multipolar flux systems (Li et al., 2008). In this configuration, a CME may initiate via the breakout mechanism (Antiochos et al., 1999), where the breakout reconnection at an overlying, stressed null point gives rise to an increasing expansion of the energized streamer arcade that eventually triggers explosive flare reconnection below the rising sheared/twisted flux rope field lines. Under certain conditions, this multipolar topology has been shown to support consecutive eruptions from the same flux system (homologous eruptions; e.g., DeVore and Antiochos, 2008) and consecutive eruptions from adjacent flux systems (sympathetic eruptions; e.g., Török et al., 2011; Lynch and Edmondson, 2013; Dahlin et al., 2019). Shen et al. (2012) and Zhou et al. (2021) studied sympathetic filament eruptions in quadrupolar and tripolar magnetic field regions, respectively, and proposed that the magnetic implosion mechanism might be a possible link between the successive flux rope eruptions.
Although typically observed to be slow, an SBO-CME’s interplanetary counterpart (ICME) may deflect and compress the ambient plasma ahead of it. This causes draping of the interplanetary magnetic field (IMF) about the ICME, where the pattern of draping depends on the overall size and shape of the ICME as well as its speed relative to the upstream plasma (Gosling and McComas, 1987; McComas et al., 1988). The draped IMF may interact with an ICME via magnetic reconnection (McComas et al., 1994; Dasso et al., 2006), which may significantly erode its original magnetic flux and helicity (Dasso et al., 2006; Ruffenach et al., 2015; Pal et al., 2020, 2021; Pal, 2022).
During its fifth orbit around the Sun, Parker Solar Probe (PSP; Fox et al., 2016) crossed an SBO-CME at a heliospheric distance of 0.52 AU. Along with PSP, the CME was also observed by BepiColombo and Wind (Möstl et al., 2022). The CME was a stealth event that followed consecutive eruptions initiated from the Earth-facing solar disk. In this study, by multi-vantage point remote-sensing, white-light, and in-situ observations, we discuss the initiation and launch of this SBO-CME and its interaction with its surroundings in the heliosphere. In Section 2, we describe the satellite data sets utilised in this study. Section 3 provides an overview of the event at its origin and in the interplanetary medium. In Section 4, we present our analysis of the remote-sensing EUV and white light coronagraph data to describe the SBO-CME eruption and its coronal dynamics. In Section 5, we present our analysis of the in-situ plasma and magnetic field observations by PSP to describe the SBO-CME’s heliospheric evolution. Finally, in Section 6, we discuss our results and present our conclusions.
2 Data Sets
To perform this study, we use remote-sensing white-light data from the inner (COR1) and outer (COR2) coronagraphs (field of views or FOVs: 1.5–4 R⊙ and 2.5–15 R⊙, respectively), part of the Sun–Earth Connection Coronal and Heliospheric Investigation (SECCHI; Howard et al., 2008) onboard the Solar Terrestrial Relations Observatory (STEREO; Kaiser et al., 2008) Ahead (STEREO-A) spacecraft, and the C2 camera (FOV: 1.6–6 R⊙) part of the Large Angle and Spectrometric Coronagraph (LASCO; Brueckner et al., 1995) onboard the Solar and Heliospheric Observatory (SOHO; Domingo et al., 1995). We use extreme ultra-violet (EUV) imagery of the solar disk from the Extreme UltraViolet Imager (EUVI) camera onboard STEREO-A and the Atmospheric Imaging Assembly (AIA; Lemen et al., 2012) instrument onboard the Solar Dynamics Observatory (SDO; Pesnell et al., 2012), and photospheric radial synoptic magnetograms from the Heliospheric Magnetic Imager (HMI; Scherrer et al., 2012) onboard SDO. In-situ solar wind measurements are obtained from the fluxgate magnetometer, a part of the PSP’s FIELDS (Bale et al., 2016) investigation, as well as the Solar Probe Cup (SPC; Case et al., 2020) and the Solar Probe ANalyzers-Electron (SPAN-E; Whittlesey et al., 2020) instruments, part of PSP’s Solar Wind Electrons Alphas and Protons (SWEAP; Kasper et al., 2016) investigation.
3 Event Overview
The SBO-CME first appeared over the west limb with a “classical” three-part structure, i.e., a bright front followed by a dark cavity containing a bright core Illing and Hundhausen (1983), in STEREO-A/COR2 images (from ∼70° East of the Sun–Earth line at ∼1 AU) around tstart = 16:30 UT on 22 June 2020. STEREO-A/COR1 and COR2 observations of a gradual swelling of the overlying streamer before the eruption and a depleted corona afterward are the characteristic signatures used to identify this eruption as a slow SBO-CME. We also identified two preceding eruptions that significantly distorted and/or disrupted the overlying coronal helmet streamer leading up to and enabling the third, slow eruption of the SBO-CME.
Figures 1–3 show remote observations summarizing the source region of the stealth SBO-CME event (hereafter CME #2) and the two preceding eruptions (hereafter CMEs #0 and #1). Figure 1A shows the HMI synoptic magnetogram for Carrington Rotation (CR) 2,232 where the red, green, and orange vertical lines indicate the Carrington longitude of the STEREO-A, SOHO, and PSP spacecraft positions at the time of the SBO-CME, respectively. In the LASCO/C2 coronagraph, CME #2 appeared as a faint event on the western side of the solar disc. Although the appearance of CME #2 in the coronagraphs indicates its origin to be from the Earth-facing side of the Sun, no clear eruptive signatures were observed in SDO/AIA imagery. Therefore, we classify CME #2 as a stealth event.
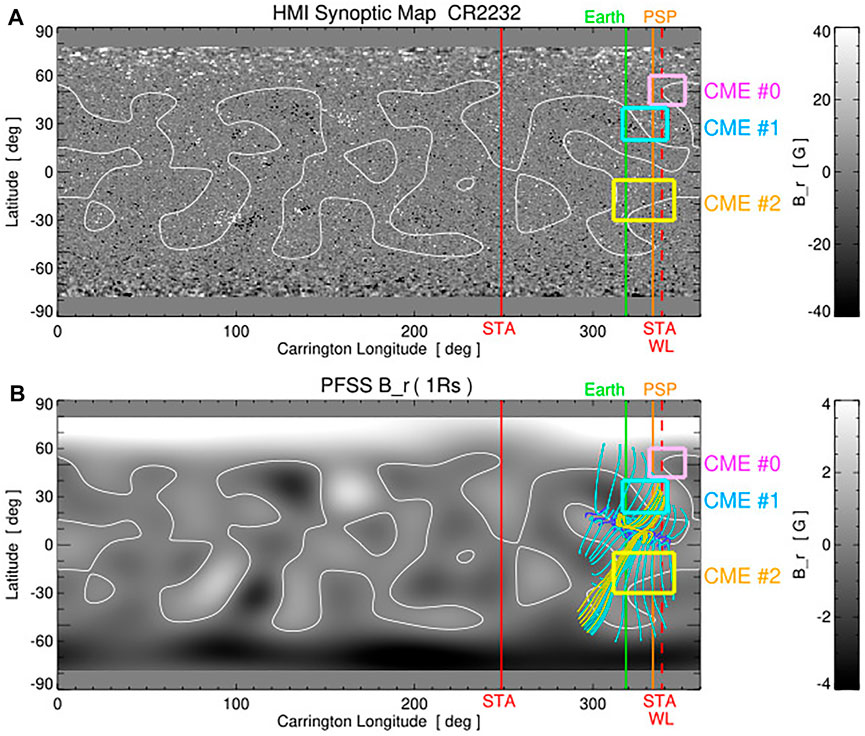
FIGURE 1. (A) Synoptic magnetogram of photospheric Br from SDO/HMI. The blue, green, and red vertical lines denote the Carrington longitude of STEREO-A, SOHO/Earth, and PSP on 21 June 2020, respectively. (B) Synoptic magnetogram of the PFSS Br showing the large-scale flux distributions with representative magnetic field lines of the multipolar flux system on STA’s west limb (WL; red dashed vertical line). In both panels the average magnetic PILs are shown as the white contours and the three CME source regions are indicated.
It is apparent from EUV imagery that CME #2 lifted off from the southern hemisphere. By modeling the coronal evolution of the CME using the Forecasting a CME’s Altered Trajectory (ForeCAT; Kay et al., 2015) model and confirming its results with the output of the graduated cylindrical shell (GCS; Thernisien et al., 2006) model applied to coronagraph data, Palmerio et al. (2021a) found that the CME deflected towards the HCS. In the upper corona, we obtain a de-projected speed for the CME of ≈220 km/s through forward modeling with the GCS technique. The obtained speed is very similar to the typical values for stealth CMEs (Ma et al., 2010) and consistent with the results in Section 4.3. The CME arrived at PSP, located at 0.52 AU and ∼20° west of the Sun–Earth line, on 25 June, approximately 3 days after its detection in STEREO/COR2. At PSP the event featured a smoothly rotating magnetic field direction, high-intensity magnetic field, and low plasma-β
4 Remote-Sensing Observations and Analysis of the SBO-CME
Off-limb STEREO-A/EUV, COR1, and COR2 imagery reveal that the SBO-CME eruption was part of a multi-stage, sequential (and most likely sympathetic) eruption scenario (e.g., Török et al., 2011; Lynch and Edmondson, 2013; Schrijver et al., 2013). In this Section, we identify the coronal source regions and analyse the coronal dynamics of each of the sequential eruptions leading up to and including the SBO-CME.
4.1 Solar Sources of the Sequential Eruptive Events
The HMI synoptic map shown in Figure 1A depicts a typical solar minimum/quiet-Sun corona. Figure 1B shows a low-order potential field source surface (PFSS; Wang and Sheeley, 1992) representation of the global magnetic field during CR2232. In both panels, the PFSS global polarity inversion lines (PILs) are plotted as white contours. Representative PFSS field lines are shown in Figure 1B over the synoptic map. At the longitudes of Earth and PSP (green and orange vertical lines, respectively), the latitudinal distribution of the radial field show a sequence of +, −, +, − polarities from north to south with three main PILs on the Earth-facing disk, resulting in a multipolar configuration beneath the helmet streamer (i.e. the topology required for the magnetic breakout CME initiation of Antiochos et al., 1999). Figures 2A,B show SDO/AIA 211 Å EUV image and the AIA 211 Å image in base-difference to highlight the location of the on-disk signature associated with the first of the sequential eruptions, CME #0. This region (the ∼20° × ∼15° area marked in pink) is located outside and to the northwest of the equatorial multipolar flux system. Representative PFSS field lines are also shown in SDO/AIA 211 Å images (Figures 2A,B), and in a composite of STEREO-A EUVI 195 Å and COR1 data (Figure 3A). Figure 3A shows the side-lobe flux systems in cyan, the central flux system in blue, the overlying flux system in orange, and open field lines in magenta. Figure 3B indicates the off-limb EUVI emission features identified as the progenitors for the second (CME #1) and third (CME #2) eruptions of the event sequence. The comparison of the PFSS topology in Figure 3A and the locations of the high-altitude progenitors for CMEs #1 and #2 in Figure 3B clearly indicate that CMEs #1 and #2 originate in the (energized) northern and southern side-lobes of the streamer flux system, respectively. An animation of the limb-enhanced STEREO-A EUVI 195 Å imaging data is included as Supplementary Video S1 in the supplementary material. In the animation, all three sequential eruptions (CMEs #0, #1, and #2) are indicated using arrows, although for the animations, we recommend viewers manually sweep the slider/progress bar quickly back and forth to more easily identify the evolutionary dynamics.
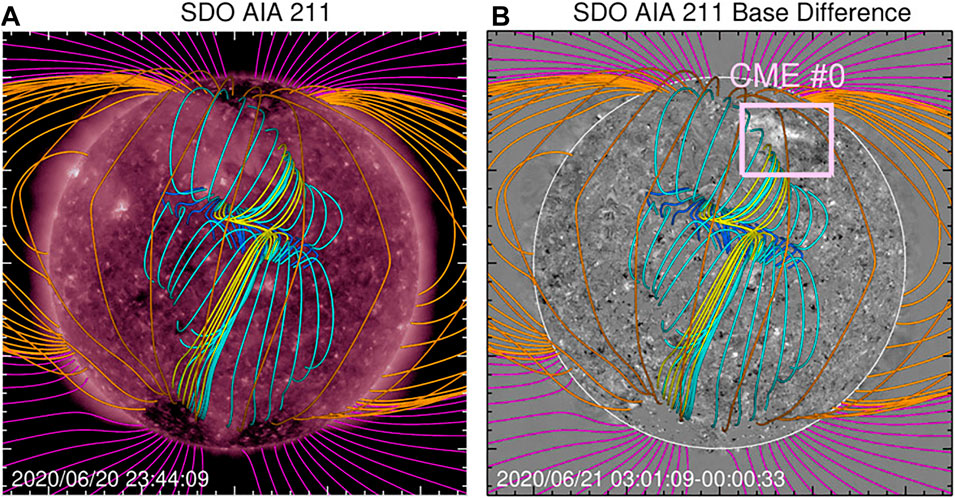
FIGURE 2. (A) SDO/AIA 211Å emission and representative PFSS magnetic field lines illustrating the different flux systems on the Earth-facing solar disk. (B) The same PFSS field lines plotted over the base-difference 211Å image. The on-disk eruption signatures (and source region) for CME #0 (pink) are to the northwest of the multipolar flux system.
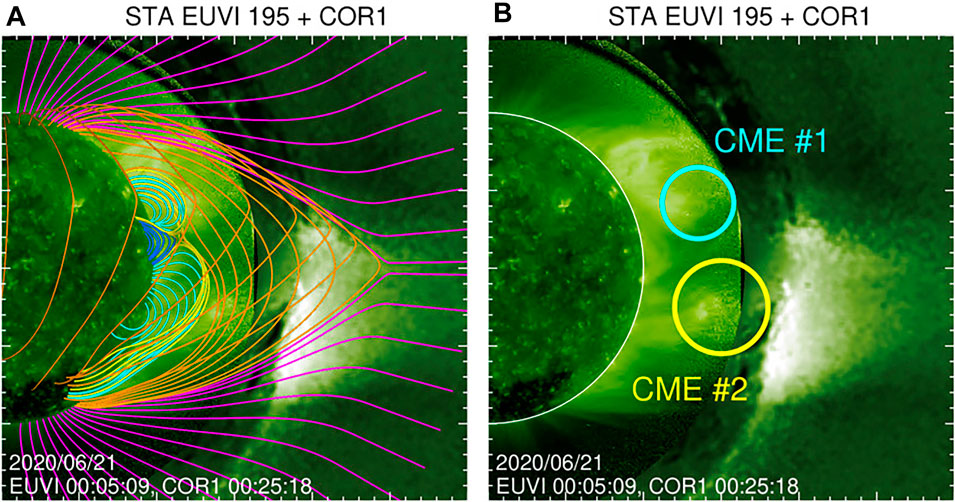
FIGURE 3. (A) Composite image showing the limb-enhanced STA/EUVI 195Å emission together with the processed STA/COR1 white light observations. Representative PFSS magnetic field lines are also shown to identify the (approximate) positions of the different flux systems on the west limb. (B) The same composite image as panel (A) with annotation to show the pre-eruption (flux rope) progenitors for CME #1 (cyan) and CME #2 (yellow) at r ∼ 1.3R⊙ in the northern and southern side-lobe arcades, respectively. An animation of the limb-enhanced STA/EUVI data is included as Supplementary Video S1 in the supplementary materials.
4.2 STEREO-A/COR1 Image Processing and Height–Time Profiles
To understand the eruption dynamics we analyse STEREO-A/COR1 and COR2 data and fit the height–time points calculated from the COR2 J-maps. The J-maps are time-elongation maps created following the method explained in Sheeley et al. (1999). We utilise processed COR1 data available at STEREO Science Center which gives an image every Δt ∼ 5 min (i.e., tn = n Δt). The first step is to read in all the files (N) and make a minimum background image from the data sequence.
We note this is essentially the same procedure that is used to construct (and remove) the F-corona background component in the standard processing of SOHO/LASCO or STEREO/SECCHI coronagraph data. Our application to the previously processed COR1 data represents the removal of a minimum K-corona background. Next, we loop through image sequence data and 1) subtract the Ibkg minimum, 2) multiply by a (weak) radial function
In the final step, we saturate the intensity range from the resulting image to enhance the contrast. This results in a type of base-difference image sequence where the (averaged) difference
4.3 Height–Time Fit Parameters
To fit the points in the height–time “J-maps” derived from the STEREO-A/COR1 and COR2 measurements, we use the Sheeley et al. (1999) formulation given by,
that results in an analytic expression for the velocity as a function of radial distance,
This functional form has four free parameters, (r0, t0, ra, va ). The initial position is given by r0 at time t0. The parameter va is the asymptotic velocity (as r → ∞) and ra is the radial distance that v(r) achieves 80% of its asymptotic value.
We use the IDL function curvefit.pro to minimize the χ2 error between the observed height–time points and the model values from Eq. 3. The weights given to each point h(ti) for the fitting procedure are uniform, i.e. wi = 1 for each i. The best-fit parameter values for each profile are listed in Table 1 along with the velocity v(r) evaluated at r = 20R⊙. The height–time points are shown in Figures 4G,H while the corresponding velocity profiles are shown in Figure 4I.
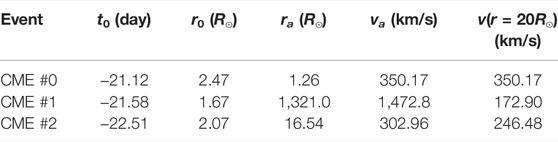
TABLE 1. Best-fit parameters for the height–time profiles of the three sequential eruptions.
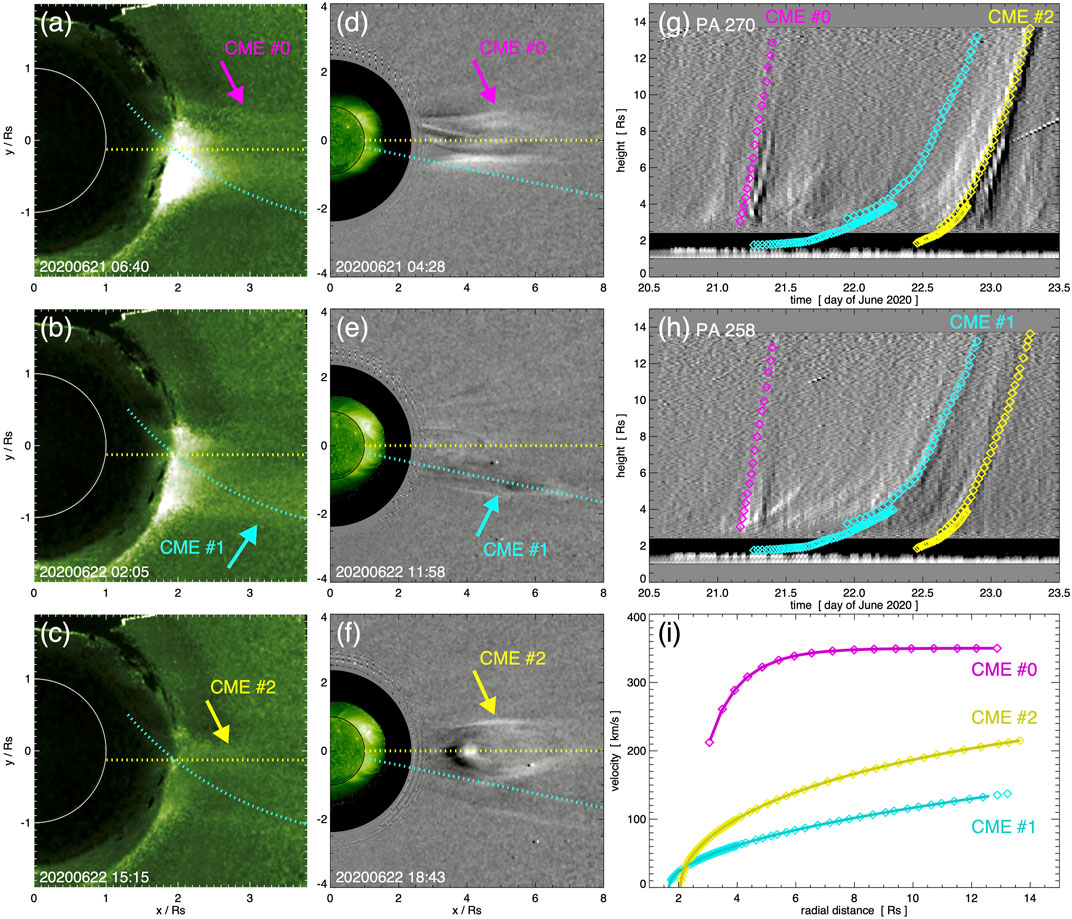
FIGURE 4. Coronal dynamics for each of the three sequential CMEs over the 2020 June 21–22 sequential/sympathetic eruption period. (A–C) STA/COR1 signatures of CMEs #0, #1, and #2, respectively. The processed COR1 movie is available as Supplementary Video S2 in the supplementary material. The cyan (yellow) dotted line shows the sampling track of CME #1’s (CME #2’s) COR1 height-time points. (D–F) STA/COR2 running-difference signatures of each eruption with PAs 258 (cyan) and 270 (yellow) used in the COR2 height-time points for CME #1 and CMEs #0 and #2, respectively. The running difference COR2 movie is included as Supplementary Video S3 in the supplementary material. (G) STA/COR2 J-map at PA 270 with the height-time points over-plotted. (H) STA/COR2 J-map at PA 258. (I) Radial evolution of the CME velocity from fits to the Sheeley et al. (1999) formulation for the height-time profiles (CME #0–magenta, #1–cyan, #2–yellow).
4.4 Eruption Scenario and Coronal Dynamics
In the following section we report the low-coronal signatures of each of the three sequential CMEs and their dynamics through the FOVs of the coronagraphs. Herein, we localize features in the EUV and coronagraph images using the position angle (PA), i.e,. the counter-clockwise angle from 0° pointing up (solar north).
CME #0 is the only eruption that had easily recognizable on-disk signatures in SDO/AIA data. Figure 2B shows that these signatures are largely outside of the multipolar flux system. Despite CME #0’s source region being behind the limb (from the STEREO-A view), the upper edge of the northern side-lobe arcade does brighten in the off-limb EUVI 195 Å data, beginning on 21 June at 00:54 UT and followed by an apparent loop opening at ∼1.3 R⊙ and PA 308°. The EUVI off-limb activity continues through ∼03:30 UT. The AIA 211 Å dimming shown in Figure 2B begins on 21 June at ∼03:00 UT, followed immediately by a brightening that expands northward until it reaches the coronal hole boundary. The first indication of CME #0 in the COR2 running-difference data occurs at 03:24 UT as a brightening at the northern edge of the helmet streamer. The top portion of the streamer is apparently blown out (detaches) and has a concave-up morphology in the running-difference COR2 movie (Figure 4D, Supplementary Video S3). By 04:54 UT, the leading edge of the CME #0 ejecta has reached ∼6 R⊙ (at PAs 265–280°) while the trailing edge is at ∼2.7 R⊙. Figure 4 (top row) shows the CME #0 streamer detachment eruption in STEREO-A COR1 data, COR2 running-difference data, and in the J-map height–time plot at PA 270° as panels Figures 4A,D,G, respectively. Figure 4I shows that CME #0 quickly reaches a constant, 350 km/s radial velocity for r ≥ 6 R⊙.
The next two CMEs (#1 and #2) originate from the northern and southern side-lobes of the equatorial multipolar flux system. These eruptions occur much closer in time, with the upper part of the northern side-lobe EUVI enhancement in Figure 3B apparently rolling down the boundary of the central arcade structure, beginning to disconnect on 21 June at 09:24 UT (at 1.3 R⊙, PA
The remainder of the remote-sensing analysis focuses on the third sequential/sympathetic eruption, CME #2, i.e., the SBO-CME. The circular, pre-eruption EUVI enhancement labeled in Figure 3B occurs over PA 255–265° at an altitude of 1.3–1.6 R⊙ and may correspond to CME #2’s pre-eruption flux rope core/central axis. This feature shows a slow, rolling motion, beginning at 05:40 UT on 21 June (see Supplementary Video S1). There are other dynamic features also seen in the southern side-lobe arcade before CME #2’s eruption. For example, a bright loop begins to contract/shrink in response to CME #1’s activity in the northern side-lobe arcade which occurs simultaneously with CME #2’s flux rope progenitor beginning to rise with a slight northwestern trajectory. This EUV structure disappears from the EUVI field of view at 17:54 UT. By 19:55 UT, there is a slight enhancement of a Y-shaped feature with the vertical segment at PA 256° and the V-shaped split at 1.27 R⊙, PA 260°. In COR1, the remaining helmet streamer material diminishes in brightness between CME #1 and the eruption of CME #2. Another V-shaped emission structure becomes visible at 11:15 UT on 22 June, at ∼2 R⊙, PA 270°. The COR1 V-shape shows rapid acceleration and leaves the frame by 22 June at 19:25 UT. The leading edge of CME #2 becomes visible in COR2 data at 14:13 UT. By 14:55 UT, the circular core appears at the inner boundary (2.6–3.2 R⊙, PA 264–278°). The 3-part CME structure is clearly visible in Figure 4F and its kinematics are captured in the J-maps and velocities of Figures 4G–I. CME #2 shows a larger acceleration than CME #1, reaching a speed of ∼220 km/s by 14 R⊙.
5 In-situ Observations and Analysis of the SBO-CME
Figure 5 shows PSP in-situ observations of the solar wind during 24–27 June 2020. On 25 June, the PSP magnetometer recorded a steady enhancement in magnetic field magnitude B, the initiation of a smooth rotation in the magnetic field vector (as indicated by the BT and BN variation), and an increment in the plasma velocity Vsw. Based on the in-situ signatures, we estimate that the leading-edge of the ICME encountered the spacecraft at tin = 16:00 UT on 25 June. The coherent rotation in the magnetic field longitude angle ϕB (measured between B projected onto the R–T plane and
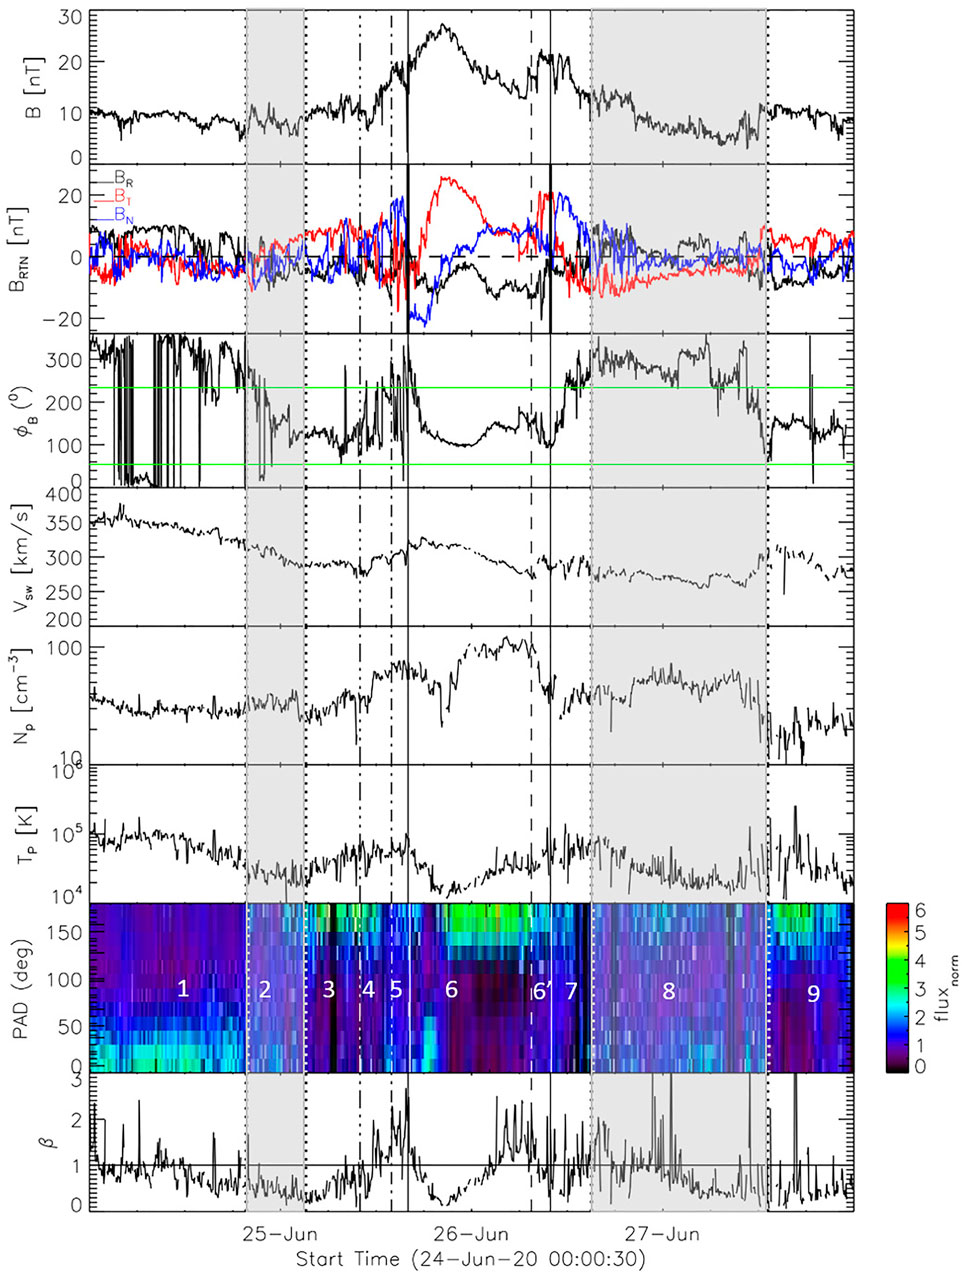
FIGURE 5. Solar wind magnetised plasma measurements (from top to bottom: B, BRTN, ϕB, Vsw, Np, Tp, PAD of normalised suprathermal electron flux, plasma-β) during 24–27 June 2020. The ϕB between horizontal green lines correspond to sunward IMF. The solid black lines show tin and tout and the dashed vertical line indicates
5.1 Minimum Variance Analysis and ICME Magnetic Flux Erosion
We employ nested-bootstrap minimum variance analysis (MVA; Sonnerup and Cahill, 1967; Kawano and Higuchi, 1995) method and a self-similarly expanding linear force-free FR (LFF) model having cylindrical cross-section (Burlaga, 1988; Lepping et al., 1990; Hidalgo et al., 2000; Marubashi and Lepping, 2007) to the in situ observations of the magnetic profile of MC. Following Ruffenach et al. (2015), we perform 1,000 random data re-sampling and repeat this for seven nested time intervals separated by 10 min within the MC. Here, each time interval starts 10 min after and ends 10 min before the previous time interval. Utilising these methods to MC in situ observations, we determine the MC axis orientation (θax, ψax) in RTN coordinates.
The bootstrap method (Kawano and Higuchi, 1995) with random data re-sampling helps assessing the impact of the intrinsic variability inherent in the magnetic field data on the axis determination and the nested time intervals within the MC mitigates the uncertainty involved in defining the MC boundaries on the determination of its axis. After obtaining the MC frame (
We apply the model-independent “direct method” (Dasso et al., 2005b) that estimates MC flux accumulated in the azimuthal plane, ϕp,acc, directly from the observed magnetic field and plasma speed profiles in MC, assuming cylindrical symmetry for the magnetic field configuration in the MC’s cross-section. This method computes azimuthal flux in the outbound path (from the MC center at t = tc to its boundary at t = tout) as
where
where rpsp and Vmc denote the Sun–PSP distance and the central speed of the MC, respectively (Dasso et al., 2007).
To quantify the azimuthal flux eroded due to reconnection, we calculate the inbound–outbound flux asymmetry. If reconnection occurs at the front of the MC, the reconnected flux that still remains part of the MC causes an outbound asymmetry in ϕp,acc. Therefore, the azimuthal flux contained in the FR before the erosion is
5.2 SBO-CME Adjacent Interplanetary Structures
In Figure 6A, we present a schematic of the MC and its adjacent interplanetary structures along with the PAD of normalised suprathermal electron flux as observed by PSP. Here and in the following discussion, the segments indicated by numbers 1–9 correspond to the annotated regions of Figure 5.
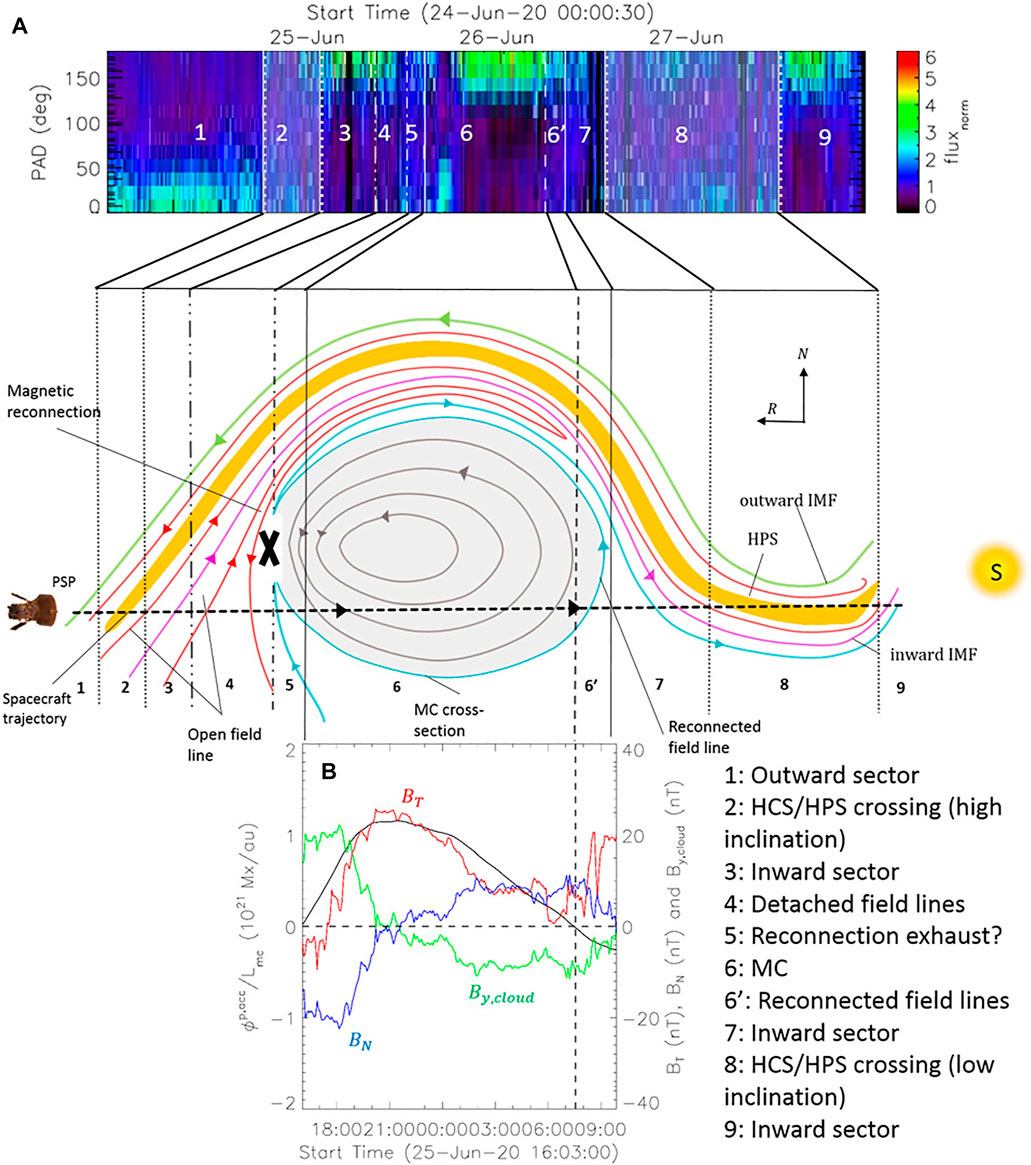
FIGURE 6. (A) The PAD of the normalized suprathermal electron flux during 24–27 June 2020 and a schematic (not to scale) showing the MC cross-section (grey) and adjacent interplanetary structures as observed by PSP. The regions 1–9 are indicated on the plots. The inward and outward IMFs connected to the solar origin are shown in purple and green, respectively. IMFs indicated in red and cyan correspond to open field lines disconnected from their solar origins and reconnected with MC, respectively. The HCS/HPS is shown in yellow and the PSP propagation path (in the FR frame of reference) is shown in dashed black line. (B) The time distribution of accumulated azimuthal flux (ϕp,acc/Lmc), azimuthal field line (By,cloud) and magnetic vectors (BN, BT). The dashed line indicates
The continuous probing of solar wind preceding and following the MC indicates the presence of large-scale interplanetary structures around the MC. PSP came across an outward field line sector 1) until 19:42 UT on 24 June, when it encountered a true sector boundary (TSB; 2)—a boundary between the magnetic field lines of true opposite polarity at their solar source (Kahler and Lin, 1994; Crooker et al., 1996; Kahler et al., 1996). It is identified by a switch in direction of suprathermal electrons from field-aligned to anti-field-aligned. The values of ϕB between the horizontal green lines (i.e., 54° < ϕB < 234°) in the third panel of Figure 5 correspond to the inward-directed field with respect to the Parker spiral field with a local spiral angle of 36°. During 2, ϕB displayed a ∼180° change across one of the nominal sector boundaries (green lines). Also, the suprathermal electron PAD becomes isotropic, indicating a drop in heat flux (McComas et al., 1989) during that time. Thus, 2 (19:42 UT 24 June – 03:11 UT 25 June) shown by the first shaded region in Figure 5, contains the HCS crossing (e.g., Crooker et al., 2004; Lavraud et al., 2020). The coincidence of the TSB, current sheet, and elevated plasma β at scales from minutes to few hours indicates the presence of a steady-state heliospheric plasma sheet (HPS; Crooker et al., 2004) encasing the HCS. The front of two coincides with a minor ∼25 min β peak. This confirms the presence of the HPS in that region. Also, two corresponds to a high Np and low Tp compared to the surroundings as well as a negative velocity gradient, which generally characterize the isotropic PAD region (McComas et al., 1989). Magnetic reconnection across the HCS above a coronal streamer may generate detached magnetic structure and isotropize the suprathermal electron PAD (McComas et al., 1989; Crooker et al., 2003; Gosling et al., 2005b; Chollet et al., 2010; Carcaboso et al., 2020). Due to the lack of good-quality, high-resolution data, we are unable to locate reconnection exhaust signatures (Gosling et al., 2005a; Phan et al., 2020) at the front and rear boundary of 2. We employ MVA to the magnetic field data over two and estimate the absolute latitude angle θn of the direction normal to the local current sheet (Lepping et al., 1996a,b). We obtain θn as 49°, indicating that the HCS surface was inclined to the spacecraft orbital plane. This was likely resulting from the IMF draping about the MC, which may lead to MC erosion via magnetic reconnection.
After 2, there exists an inward field line sector 3) followed by a short interval of isotropic PAD region (4). Just before the MC front boundary, during 13:55–16:00 UT on 25 June (5), we locate a region with an accelerated Vsw, higher Np, higher Tp, and reduced B than the surrounding solar wind. These indicate a possibility of the presence of reconnection exhaust (Gosling et al., 2005a). However, due to the insufficient resolution of plasma data this cannot be confirmed. The dash-dotted line in Figure 5 indicates the start time of 5. After the passage of the MC (6 and 6’), there exists an inward IMF region 7) followed by region 8 (15:03 UT 26 June–13:11 UT 27 June; second shaded region in Figure 5) with enhanced Np, reduced Tp than the surroundings, and isotropic distribution of solar wind electrons, where ϕB hovered near the boundary between the outward and inward sectors until it made a definite turn towards the inward sector at 10:50 UT on 27 June accompanied by a sharp peak in β. Taken together, these signatures suggest that once again PSP encountered the HCS and HPS. During 8, θn is found to be 61°, indicating a low inclination of region eight to the PSP orbital plane. After 8, there exists a region 9) of inward IMF.
5.3 ICME Interaction With the Draped Interplanetary Magnetic Field
To determine whether the IMF draping evident from the in-situ observations resulted in erosion of MC flux via reconnection, we further analyse the MC’s magnetic flux profile. We only focus on its azimuthal flux, because erosion mainly affects the MC’s outer part where azimuthal flux dominates. After obtaining the MC’s axis orientation using nested-bootstrap MVA and LFF fitting, we derive the MC’s accumulated azimuthal flux
In Table 2, we summarise the results obtained from the in situ observation analysis of the MC. We provide nested-bootstrap MVA and LFF fitting results and MC’s azimuthal flux balance-related analysis. Utilising the ICME’s Sun-to-PSP transition speed Vtr ∼ 300 km/s and trec, we obtain the heliospheric distance rrec = Vtr (trec − tstart) after which the ongoing flux erosion might have started. We provide the result in Table 2. Note that erosion of the original flux rope might have started closer to the Sun, with the corresponding back region having lost identifiable CME properties (and having become fully detached from the CME) by the time of observation at PSP. In Figure 5,
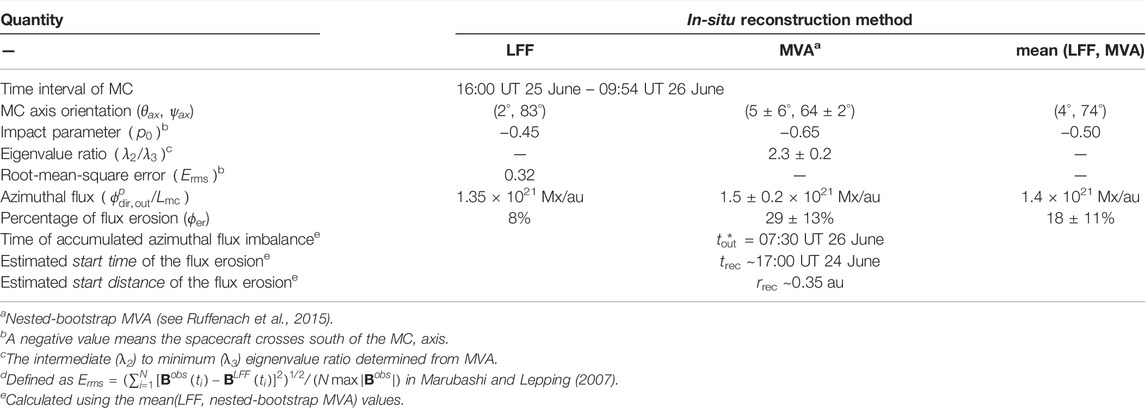
TABLE 2. Summary of results obtained from the ICME in-situ flux analysis at PSP.
6 Discussion and Conclusion
The primary focus of this work was to investigate the initiation and formation of a stealth CME and its interaction with surrounding interplanetary structures. The spatiotemporal proximity between the sequence of three eruptions observed over STEREO-A’s west limb, combined with the large-scale geometry of the PFSS coronal field extrapolation, strongly suggest a direct and causal magnetic coupling between the eruptions (Schrijver et al., 2013). In the Török et al. (2011) MHD simulation, their coupled, sympathetic eruptions from the adjacent flux systems of a coronal pseudostreamer were triggered by a prior eruption external to the pseudostreamer arcades. In our study, CME #0 plays an analogous role, removing a portion of the overlying (restraining) helmet streamer flux and disrupting the quasi-equilibrium force-balance of the energized, multipolar flux system. CMEs #1 and #2 then erupt sympathetically, in succession. CME #1 starts in the northern side-lobe arcade, is seen to deflect south, and given the orientation of the PFSS arcades in Figure 1, likely propagates toward STEREO-A. CME #2 starts in the southern side-lobe and is deflected northward (Palmerio et al., 2021a). As discussed in Lynch and Edmondson (2013), each of the sympathetic CMEs’ non-radial deflections are toward their overlying breakout current sheet which corresponds to the local magnetic pressure minimum (path of least resistance). More generally, there are many examples of mid-to high-latitude eruptions deflecting towards the HCS as they become SBO-CMEs (e.g., Kilpua et al., 2009; Panasenco et al., 2013; Zheng et al., 2020; Getachew et al., 2022). Further numerical modeling is needed to confirm this multipolar sympathetic eruption scenario and to characterize the reconnection flux transfer between arcades during this multi-stage, SBO-CME event.
At ∼0.5 AU, PSP witnessed the draping of IMF that reconnected with the SBO-CME (CME #2) and eroded almost 20% of its azimuthal flux. Analysing the MC’s back region populated with reconnected field lines, we estimate that the reconnection might have initiated after 17:00 UT on 24 June at a heliospheric distance of ∼0.35 AU. A lower inclination (∼29°) of plasma sheet behind the CME than the inclination (∼41°) of plasma sheet in front of it indicates the draping of IMF about the MC having asymmetric, expanding, and non-circular FR structure. The asymmetry in magnetic field intensity has been quantified by CB,t (Janvier et al., 2019) and CB,x (Démoulin et al., 2020) in temporal and spatial coordinates, respectively, where a negative value of CB,t and CB,x indicates a non-circular, expanding cross-section of a FR. In our study we find CB,t ∼ CB,x ∼ − 0.04.
With the aid of coronal field extrapolations as well as remote and in-situ observations, we explain in this study the formation of a classic slow SBO-CME and examine the interplay with its surroundings in the inner heliosphere. By analyzing the PFSS geometry and the dynamics in low-coronal EUV and white-light imagery, we show that the CME followed two prior eruptions from nearby source regions and suggest coronal reconnection played a significant role in the eruption process. The CME’s inner-heliospheric propagation resulted in a draping of the heliospheric field adjacent to the HCS about the CME flux rope. It forced the HCS to be inclined to the spacecraft orbital plane with a moderate and low inclination angle ahead and behind the CME, respectively, at a ∼0.5 AU heliospheric distance. Thus, this study provides important implications for the origin and interactions of a slow eruptive flux rope in the interplanetary medium and highlights the necessity of continuous off-limb observations away from the Sun–Earth line leading to a better exploration of the dynamics of stealthy CMEs in the low corona and inner heliosphere.
Data Availability Statement
The datasets presented in this study can be found in online repositories. The names of the repository/repositories and accession number(s) can be found below: https://sdac.virtualsolar.org/, https://stereo-ssc.nascom.nasa.gov/, https://cdaweb.gsfc.nasa.gov/index.html/.
Author Contributions
SP, BL, SG, EP, and EK contributed to conception and design of the study. SP, BL, SG, and EP performed the analysis. SP and BL wrote the first draft of the manuscript. MS organised the solar wind data. All authors contributed to manuscript revision, and approved the submitted version.
Conflict of Interest
EP was employed by Predictive Science Inc.
The remaining authors declare that the research was conducted in the absence of any commercial or financial relationships that could be construed as a potential conflict of interest.
Publisher’s Note
All claims expressed in this article are solely those of the authors and do not necessarily represent those of their affiliated organizations, or those of the publisher, the editors and the reviewers. Any product that may be evaluated in this article, or claim that may be made by its manufacturer, is not guaranteed or endorsed by the publisher.
Acknowledgments
This work was performed within the framework of Academy of Finland Centre of Excellence grant 312390 (FORESAIL). SP and EK acknowledge the European Research Council (ERC) under the European Union’s Horizon 2020 Research and Innovation Program Project SolMAG 724391. BL acknowledges support from NSF AGS-1851945, NASA 80NSSC19K0088, NASA 80NSSC21K0731, and the HERMES Heliophysics DRIVE Center. SG and EK acknowledge Academy of Finland Project 310445 (SMASH). EP acknowledges support from NASA’s PSP-GI (No. 80NSSC22K0349) and HTMS (No. 80NSSC20K1274) programs. EA acknowledges Academy of Finland (Postdoctoral Grant Nos. 322455). SP thanks Katsuhide Marubashi for providing us with the linear force-free cylindrical model. We acknowledge the PSP/FIELDS, PSP/SWEAP, SDO/AIA, SOHO/LASCO, and STEREO/SECCHI teams.
Supplementary Material
The Supplementary Material for this article can be found online at: https://www.frontiersin.org/articles/10.3389/fspas.2022.903676/full#supplementary-material
References
Antiochos, S. K., DeVore, C. R., and Klimchuk, J. A. (1999). A Model for Solar Coronal Mass Ejections. Astrophys. J. 510, 485–493. doi:10.1086/306563
Bale, S. D., Goetz, K., Harvey, P. R., Turin, P., Bonnell, J. W., Dudok de Wit, T., et al. (2016). The FIELDS Instrument Suite for Solar Probe Plus. Space Sci. Rev. 204, 49–82. doi:10.1007/s11214-016-0244-5
Brueckner, G. E., Howard, R. A., Koomen, M. J., Korendyke, C. M., Michels, D. J., Moses, J. D., et al. (1995). The Large Angle Spectroscopic Coronagraph (LASCO). Sol. Phys. 162, 357–402. doi:10.1007/978-94-009-0191-9_10
Burlaga, L. F. (1988). Magnetic Clouds and Force-free Fields with Constant Alpha. J. Geophys. Res. 93, 7217–7224. doi:10.1029/JA093iA07p07217
Carcaboso, F., Gómez-Herrero, R., Espinosa Lara, F., Hidalgo, M. A., Cernuda, I., and Rodríguez-Pacheco, J. (2020). Characterisation of Suprathermal Electron Pitch-Angle Distributions. Astron. Astrophys. 635, A79. doi:10.1051/0004-6361/201936601
Case, A. W., Kasper, J. C., Stevens, M. L., Korreck, K. E., Paulson, K., Daigneau, P., et al. (2020). The Solar Probe Cup on the Parker Solar Probe. ApJS 246, 43. doi:10.3847/1538-4365/ab5a7b
Chollet, E., Skoug, R., Steinberg, J., Crooker, N., Giacalone, J., Maksimovic, M., et al. (2010). “Reconnection and Disconnection: Observations of Suprathermal Electron Heat Flux Dropouts,” in Twelfth International Solar Wind Conference. Vol. 1216 of American Institute of Physics Conference Series. Editors M. Maksimovic, K. Issautier, N. Meyer-Vernet, M. Moncuquet, and F. Pantellini, 600–603. doi:10.1063/1.3395937
Crooker, N. U., Burton, M. E., Siscoe, G. L., Kahler, S. W., Gosling, J. T., and Smith, E. J. (1996). Solar Wind Streamer Belt Structure. J. Geophys. Res. 101, 24331–24341. doi:10.1029/96JA02412
Crooker, N. U., Huang, C. L., Lamassa, S. M., Larson, D. E., Kahler, S. W., and Spence, H. E. (2004). Heliospheric Plasma Sheets. J. Geophys. Res. 109, A03107. doi:10.1029/2003JA010170
Crooker, N. U., Larson, D. E., Kahler, S. W., Lamassa, S. M., and Spence, H. E. (2003). Suprathermal Electron Isotropy in High-Beta Solar Wind and its Role in Heat Flux Dropouts. Geophys. Res. Lett. 30, 1619. doi:10.1029/2003GL017036
Dahlin, J. T., Antiochos, S. K., and DeVore, C. R. (2019). A Model for Energy Buildup and Eruption Onset in Coronal Mass Ejections. Astrophys. J. 879, 96. doi:10.3847/1538-4357/ab262a
Dasso, S., Gulisano, A. M., Mandrini, C. H., and Démoulin, P. (2005a). Model-independent Large-Scale Magnetohydrodynamic Quantities in Magnetic Clouds. Adv. Space Res. 35, 2172–2177. doi:10.1016/j.asr.2005.03.054
Dasso, S., Mandrini, C. H., Démoulin, P., and Luoni, M. L. (2006). A New Model-independent Method to Compute Magnetic Helicity in Magnetic Clouds. Astron. Astrophys. 455, 349–359. doi:10.1051/0004-6361:20064806
Dasso, S., Mandrini, C. H., Luoni, M. L., Gulisano, A. M., Nakwacki, M. S., Pohjolainen, S., et al. (2005b). “Linking Coronal to Heliospheric Magnetic Helicity: A New Model-independent Technique to Compute Helicity in Magnetic Clouds,” in Solar Wind 11/SOHO 16, Connecting Sun and Heliosphere. Vol. 592 of ESA Special Publication. Editors B. Fleck, T. H. Zurbuchen, and H. Lacoste, 605.
Dasso, S., Nakwacki, M. S., Démoulin, P., and Mandrini, C. H. (2007). Progressive Transformation of a Flux Rope to an ICME. Sol. Phys. 244, 115–137. doi:10.1007/s11207-007-9034-2
Démoulin, P., Dasso, S., Lanabere, V., and Janvier, M. (2020). Contribution of the Ageing Effect to the Observed Asymmetry of Interplanetary Magnetic Clouds. Astron. Astrophys. 639, A6. doi:10.1051/0004-6361/202038077
Démoulin, P., and Dasso, S. (2009). Magnetic Cloud Models with Bent and Oblate Cross-Section Boundaries. Astronomy Astrophysics 507, 969–980.
DeVore, C. R., and Antiochos, S. K. (2008). Homologous Confined Filament Eruptions via Magnetic Breakout. Astrophys. J. 680, 740–756. doi:10.1086/588011
Domingo, V., Fleck, B., and Poland, A. I. (1995). The SOHO Mission: an Overview. Sol. Phys. 162, 1–37. doi:10.1007/BF00733425
Fox, N. J., Velli, M. C., Bale, S. D., Decker, R., Driesman, A., Howard, R. A., et al. (2016). The Solar Probe Plus Mission: Humanity's First Visit to Our Star. Space Sci. Rev. 204, 7–48. doi:10.1007/s11214-015-0211-6
Getachew, T., McComas, D. J., Joyce, C. J., Palmerio, E., Christian, E. R., Cohen, C. M. S., et al. (2022). PSP/IS⊙IS Observation of a Solar Energetic Particle Event Associated with a Streamer Blowout Coronal Mass Ejection during Encounter 6. Astrophys. J. 925, 212. doi:10.3847/1538-4357/ac408f
Gosling, J. T., Hildner, E., MacQueen, R. M., Munro, R. H., Poland, A. I., and Ross, C. L. (1974). Mass Ejections from the Sun: A View from Skylab. J. Geophys. Res. 79, 4581–4587. doi:10.1029/JA079i031p04581
Gosling, J. T., and McComas, D. J. (1987). Field Line Draping about Fast Coronal Mass Ejecta: A Source of Strong Out-Of-The-Ecliptic Interplanetary Magnetic Fields. Geophys. Res. Lett. 14, 355–358. doi:10.1029/GL014i004p00355
Gosling, J. T., Skoug, R. M., McComas, D. J., and Smith, C. W. (2005a). Direct Evidence for Magnetic Reconnection in the Solar Wind Near 1 AU. J. Geophys. Res. 110, A01107. doi:10.1029/2004JA010809
Gosling, J. T., Skoug, R. M., McComas, D. J., and Smith, C. W. (2005b). Magnetic Disconnection from the Sun: Observations of a Reconnection Exhaust in the Solar Wind at the Heliospheric Current Sheet. Geophys. Res. Lett. 32, L05105. doi:10.1029/2005GL022406
Hidalgo, M. A., Cid, C., Medina, J., and Viñas, A. F. (2000). A New Model for the Topology of Magnetic Clouds in the Solar Wind. Sol. Phys. 194, 165–174. doi:10.1023/A:1005206107017
Howard, R. A., Moses, J. D., Vourlidas, A., Newmark, J. S., Socker, D. G., Plunkett, S. P., et al. (2008). Sun Earth Connection Coronal and Heliospheric Investigation (SECCHI). Space Sci. Rev. 136, 67–115. doi:10.1007/s11214-008-9341-4
Howard, T. A., and Harrison, R. A. (2013). Stealth Coronal Mass Ejections: A Perspective. Sol. Phys. 285, 269–280. doi:10.1007/s11207-012-0217-0
Illing, R. M. E., and Hundhausen, A. J. (1983). Possible Observation of a Disconnected Magnetic Structure in a Coronal Transient. J. Geophys. Res. 88, 10210–10214. doi:10.1029/JA088iA12p10210
Janvier, M., Winslow, R. M., Good, S., Bonhomme, E., Démoulin, P., Dasso, S., et al. (2019). Generic Magnetic Field Intensity Profiles of Interplanetary Coronal Mass Ejections at Mercury, Venus, and Earth from Superposed Epoch Analyses. JGR Space Phys. 124, 812–836. doi:10.1029/2018JA025949
Kahler, S., and Lin, R. P. (1994). The Determination of Interplanetary Magnetic Field Polarities Around Sector Boundaries Using E > 2 keV Electrons. Geophys. Res. Lett. 21, 1575–1578. doi:10.1029/94GL01362
Kahler, S. W., Crocker, N. U., and Gosling, J. T. (1996). The Topology of Intrasector Reversals of the Interplanetary Magnetic Field. J. Geophys. Res. 101, 24373–24382. doi:10.1029/96JA02232
Kaiser, M. L., Kucera, T. A., Davila, J. M., St. Cyr, O. C. O. C., Guhathakurta, M., and Christian, E. (2008). The STEREO Mission: An Introduction. Space Sci. Rev. 136, 5–16. doi:10.1007/s11214-007-9277-0
Kasper, J. C., Abiad, R., Austin, G., Balat-Pichelin, M., Bale, S. D., Belcher, J. W., et al. (2016). Solar Wind Electrons Alphas and Protons (SWEAP) Investigation: Design of the Solar Wind and Coronal Plasma Instrument Suite for Solar Probe Plus. Space Sci. Rev. 204, 131–186. doi:10.1007/s11214-015-0206-3
Kawano, H., and Higuchi, T. (1995). The Bootstrap Method in Space Physics: Error Estimation for the Minimum Variance Analysis. Geophys. Res. Lett. 22, 307–310. doi:10.1029/94GL02969
Kay, C., Opher, M., and Evans, R. M. (2015). Global Trends of CME Deflections Based on CME and Solar Parameters. Astrophys. J. 805, 168. doi:10.1088/0004-637X/805/2/168
Kilpua, E. K. J., Isavnin, A., Vourlidas, A., Koskinen, H. E. J., and Rodriguez, L. (2013). On the Relationship between Interplanetary Coronal Mass Ejections and Magnetic Clouds. Ann. Geophys. 31, 1251–1265. doi:10.5194/angeo-31-1251-2013
Kilpua, E. K. J., Mierla, M., Zhukov, A. N., Rodriguez, L., Vourlidas, A., and Wood, B. (2014). Solar Sources of Interplanetary Coronal Mass Ejections during the Solar Cycle 23/24 Minimum. Sol. Phys. 289, 3773–3797. doi:10.1007/s11207-014-0552-4
Kilpua, E. K. J., Pomoell, J., Vourlidas, A., Vainio, R., Luhmann, J., Li, Y., et al. (2009). STEREO Observations of Interplanetary Coronal Mass Ejections and Prominence Deflection during Solar Minimum Period. Ann. Geophys. 27, 4491–4503. doi:10.5194/angeo-27-4491-2009
Korreck, K. E., Szabo, A., Chinchilla, T. N., Lavraud, B., Luhmann, J., Niembro, T., et al. (2020). Source and Propagation of a Streamer Blowout Coronal Mass Ejection Observed by the Parker Solar Probe. ApJS 246, 69. doi:10.3847/1538-4365/ab6ff9
Lavraud, B., Fargette, N., Réville, V., Szabo, A., Huang, J., Rouillard, A. P., et al. (2020). The Heliospheric Current Sheet and Plasma Sheet during Parker Solar Probe's First Orbit. Astrophys. J. 894, L19. doi:10.3847/2041-8213/ab8d2d
Lemen, J. R., Title, A. M., Akin, D. J., Boerner, P. F., Chou, C., Drake, J. F., et al. (2012). The Atmospheric Imaging Assembly (AIA) on the Solar Dynamics Observatory (SDO). Sol. Phys. 275, 17–40. doi:10.1007/s11207-011-9776-8
Lepping, R. P., Jones, J. A., and Burlaga, L. F. (1990). Magnetic Field Structure of Interplanetary Magnetic Clouds at 1 AU. J. Geophys. Res. 95, 11957–11965. doi:10.1029/JA095iA08p11957
Lepping, R. P., Szabo, A., Peredo, M., and Campbell, A. (1996a). “Summary of Heliospheric Current and Plasma Sheet Studies: WIND Observations,” in Proceedings of the Eigth International Solar Wind Conference: Solar Wind Eight. Vol. 382 of American Institute of Physics Conference Series. Editors D. Winterhalter, J. T. Gosling, S. R. Habbal, W. S. Kurth, and M. Neugebauer, 526–529. doi:10.1063/1.51505
Lepping, R. P., Szabo, A., Peredo, M., and Hoeksema, J. T. (1996b). Large-scale Properties and Solar Connection of the Heliospheric Current and Plasma Sheets: WIND Observations. Geophys. Res. Lett. 23, 1199–1202. doi:10.1029/96GL00658
Li, Y., Lynch, B. J., Stenborg, G., Luhmann, J. G., Huttunen, K. E. J., Welsch, B. T., et al. (2008). The Solar Magnetic Field and Coronal Dynamics of the Eruption on 2007 May 19. Astrophys. J. 681, L37–L40. doi:10.1086/590340
Lynch, B. J., and Edmondson, J. K. (2013). Sympathetic Magnetic Breakout Coronal Mass Ejections from Pseudostreamers. Astrophys. J. 764, 87. doi:10.1088/0004-637X/764/1/87
Lynch, B. J., Masson, S., Li, Y., DeVore, C. R., Luhmann, J. G., Antiochos, S. K., et al. (2016). A Model for Stealth Coronal Mass Ejections. J. Geophys. Res. Space Phys. 121, 10,677–10,697. doi:10.1002/2016JA023432
Ma, S., Attrill, G. D. R., Golub, L., and Lin, J. (2010). Statistical Study of Coronal Mass Ejections with and without Distinct Low Coronal Signatures. Astrophys. J. 722, 289–301. doi:10.1088/0004-637X/722/1/289
Marubashi, K., and Lepping, R. P. (2007). Long-duration Magnetic Clouds: a Comparison of Analyses Using Torus- and Cylinder-Shaped Flux Rope Models. Ann. Geophys. 25, 2453–2477. doi:10.5194/angeo-25-2453-2007
McComas, D. J., Gosling, J. T., Hammond, C. M., Moldwin, M. B., Phillips, J. L., and Forsyth, R. J. (1994). Magnetic Reconnection Ahead of a Coronal Mass Ejection. Geophys. Res. Lett. 21, 1751–1754. doi:10.1029/94GL01077
McComas, D. J., Gosling, J. T., Phillips, J. L., Bame, S. J., Luhmann, J. G., and Smith, E. J. (1989). Electron Heat Flux Dropouts in the Solar Wind: Evidence for Interplanetary Magnetic Field Reconnection? J. Geophys. Res. 94, 6907–6916. doi:10.1029/JA094iA06p06907
McComas, D. J., Gosling, J. T., Winterhalter, D., and Smith, E. J. (1988). Interplanetary Magnetic Field Draping about Fast Coronal Mass Ejecta in the Outer Heliosphere. J. Geophys. Res. 93, 2519–2526. doi:10.1029/JA093iA04p02519
Möstl, C., Weiss, A. J., Reiss, M. A., Amerstorfer, T., Bailey, R. L., Hinterreiter, J., et al. (2022). Multipoint Interplanetary Coronal Mass Ejections Observed with Solar Orbiter, BepiColombo, Parker Solar Probe, Wind, and STEREO-A. ApJL 924, L6. doi:10.3847/2041-8213/ac42d0
Müller, D., Nicula, B., Felix, S., Verstringe, F., Bourgoignie, B., Csillaghy, A., et al. (2017). JHelioviewer. Astron. Astrophys. 606, A10. doi:10.1051/0004-6361/201730893
Nitta, N. V., Mulligan, T., Kilpua, E. K. J., Lynch, B. J., Mierla, M., O’Kane, J., et al. (2021). Understanding the Origins of Problem Geomagnetic Storms Associated with “Stealth” Coronal Mass Ejections. Space Sci. Rev. 217, 82. doi:10.1007/s11214-021-00857-0
O’Kane, J., Green, L. M., Davies, E. E., Möstl, C., Hinterreiter, J., Freiherr von Forstner, J. L., et al. (2021). Solar Origins of a Strong Stealth CME Detected by Solar Orbiter. Astron. Astrophys. 656, L6. doi:10.1051/0004-6361/202140622
Pal, S., Dash, S., and Nandy, D. (2020). Flux Erosion of Magnetic Clouds by Reconnection with the Sun's Open Flux. Geophys. Res. Lett. 47, e2019GL086372. doi:10.1029/2019GL086372
Pal, S., Kilpua, E., Good, S., Pomoell, J., and Price, D. J. (2021). Uncovering Erosion Effects on Magnetic Flux Rope Twist. Astron. Astrophys. 650, A176. doi:10.1051/0004-6361/202040070
Pal, S. (2021). Uncovering the Process that Transports Magnetic Helicity to Coronal Mass Ejection Flux Ropes. Adv. Space Res. In Press. doi:10.1016/j.asr.2021.11.013
Palmerio, E., Kay, C., Al-Haddad, N., Lynch, B. J., Yu, W., Stevens, M. L., et al. (2021a). Predicting the Magnetic Fields of a Stealth CME Detected by Parker Solar Probe at 0.5 au. Astrophys. J. 920, 65. doi:10.3847/1538-4357/ac25f4
Palmerio, E., Nitta, N. V., Mulligan, T., Mierla, M., O’Kane, J., Richardson, I. G., et al. (2021b). Investigating Remote-Sensing Techniques to Reveal Stealth Coronal Mass Ejections. Front. Astron. Space Sci. 8, 695966. doi:10.3389/fspas.2021.695966
Panasenco, O., Martin, S. F., Velli, M., and Vourlidas, A. (2013). Origins of Rolling, Twisting, and Non-radial Propagation of Eruptive Solar Events. Sol. Phys. 287, 391–413. doi:10.1007/s11207-012-0194-3
Pesnell, W. D., Thompson, B. J., and Chamberlin, P. C. (2012). The Solar Dynamics Observatory (SDO). Sol. Phys. 275, 3–15. doi:10.1007/s11207-011-9841-3
Phan, T. D., Bale, S. D., Eastwood, J. P., Lavraud, B., Drake, J. F., Oieroset, M., et al. (2020). Parker Solar Probe In Situ Observations of Magnetic Reconnection Exhausts during Encounter 1. ApJS 246, 34. doi:10.3847/1538-4365/ab55ee
Robbrecht, E., Patsourakos, S., and Vourlidas, A. (2009). No Trace Left behind: Stereo Observation of a Coronal Mass Ejection without Low Coronal Signatures. Astrophys. J. 701, 283–291. doi:10.1088/0004-637X/701/1/283
Ruffenach, A., Lavraud, B., Farrugia, C. J., Démoulin, P., Dasso, S., Owens, M. J., et al. (2015). Statistical Study of Magnetic Cloud Erosion by Magnetic Reconnection. J. Geophys. Res. Space Phys. 120, 43–60. doi:10.1002/2014JA020628
Scherrer, P. H., Schou, J., Bush, R. I., Kosovichev, A. G., Bogart, R. S., Hoeksema, J. T., et al. (2012). The Helioseismic and Magnetic Imager (HMI) Investigation for the Solar Dynamics Observatory (SDO). Sol. Phys. 275, 207–227. doi:10.1007/s11207-011-9834-2
Schrijver, C. J., Title, A. M., Yeates, A. R., and DeRosa, M. L. (2013). Pathways of Large-Scale Magnetic Couplings between Solar Coronal Events. Astrophys. J. 773, 93. doi:10.1088/0004-637X/773/2/93
Sheeley, N. R., Howard, R. A., Koomen, M. J., Michels, D. J., Harvey, K. L., and Harvey, J. W. (1982). Observations of Coronal Structure during Sunspot Maximum. Space Sci. Rev. 33, 219–231. doi:10.1007/BF00213255
Sheeley, N. R., Walters, J. H., Wang, Y.-M., and Howard, R. A. (1999). Continuous Tracking of Coronal Outflows: Two Kinds of Coronal Mass Ejections. J. Geophys. Res. 104, 24739–24767. doi:10.1029/1999JA900308
Shen, Y., Liu, Y., and Su, J. (2012). Sympathetic Partial and Full Filament Eruptions Observed in One Solar Breakout Event. Astrophys. J. 750, 12. doi:10.1088/0004-637X/750/1/12
Smith, E. J. (2001). The Heliospheric Current Sheet. J. Geophys. Res. 106, 15819–15831. doi:10.1029/2000JA000120
Sonnerup, B. U. Ö., and Cahill, L. J. (1967). Magnetopause Structure and Attitude from Explorer 12 Observations. J. Geophys. Res. 72, 171. doi:10.1029/JZ072i001p00171
Thernisien, A. F. R., Howard, R. A., and Vourlidas, A. (2006). Modeling of Flux Rope Coronal Mass Ejections. Astrophys. J. 652, 763–773. doi:10.1086/508254
Török, T., Panasenco, O., Titov, V. S., Mikić, Z., Reeves, K. K., Velli, M., et al. (2011). A Model for Magnetically Coupled Sympathetic Eruptions. Astrophys. J. 739, L63. doi:10.1088/2041-8205/739/2/L63
Tousey, R. (1973). “The Solar Corona,” in Space Research Conference. Editors M. J. Rycroft, and S. K. Runcorn (Berlin: Akademic Verlag), Vol. 2, 713–730.
Vourlidas, A., Howard, R. A., Morrill, J. S., and Munz, S. (2002). “Analysis of Lasco Observations of Streamer Blowout Events,” in Solar-Terrestrial Magnetic Activity and Space Environment. Editors H. Wang, and R. Xu (Boston: Pergamon), Vol. 14, 201–208. doi:10.1016/s0964-2749(02)80157-3
Vourlidas, A., and Webb, D. F. (2018). Streamer-blowout Coronal Mass Ejections: Their Properties and Relation to the Coronal Magnetic Field Structure. Astrophys. J. 861, 103. doi:10.3847/1538-4357/aaca3e
Wang, Y.-M., and Sheeley, N. R. J. (1992). On Potential Field Models of the Solar Corona. Astrophys. J. 392, 310. doi:10.1086/171430
Whittlesey, P. L., Larson, D. E., Kasper, J. C., Halekas, J., Abatcha, M., Abiad, R., et al. (2020). The Solar Probe ANalyzers-Electrons on the Parker Solar Probe. ApJS 246, 74. doi:10.3847/1538-4365/ab7370
Zheng, R., Chen, Y., and Wang, B. (2020). The Initiation of a Solar Streamer Blowout Coronal Mass Ejection Arising from the Streamer Flank. Astrophys. J. 897, L21. doi:10.3847/2041-8213/ab9ebd
Keywords: coronal mass ejection (CME), heliosphere, reconnection, interplanetary magnetic field, interplanetary magnetic cloud
Citation: Pal S, Lynch BJ, Good SW, Palmerio E, Asvestari E, Pomoell J, Stevens ML and Kilpua EKJ (2022) Eruption and Interplanetary Evolution of a Stealthy Streamer-Blowout CME Observed by PSP at ∼0.5 AU. Front. Astron. Space Sci. 9:903676. doi: 10.3389/fspas.2022.903676
Received: 24 March 2022; Accepted: 10 May 2022;
Published: 31 May 2022.
Edited by:
Ramesh Chandra, Kumaun University, IndiaReviewed by:
Alphonse Sterling, National Aeronautics and Space Administration (NASA), United StatesYuandeng Shen, Yunnan Observatories, National Astronomical Observatories (CAS), China
Copyright © 2022 Pal, Lynch, Good, Palmerio, Asvestari, Pomoell, Stevens and Kilpua. This is an open-access article distributed under the terms of the Creative Commons Attribution License (CC BY). The use, distribution or reproduction in other forums is permitted, provided the original author(s) and the copyright owner(s) are credited and that the original publication in this journal is cited, in accordance with accepted academic practice. No use, distribution or reproduction is permitted which does not comply with these terms.
*Correspondence: Sanchita Pal, sanchita.pal@helsinki.fi