A weighted soil heath index approach for refined assessment of soil health in cropping systems
 Surendra Singh
 Sindhu Jagadamma
 Daniel Yoder2
  Xinhua Yin
- 1Columbia Basin Agricultural Research Center, Oregon State University, Adams, OR, United States
- 2Department of Biosystems Engineering and Soil Science, University of Tennessee, Knoxville, TN, United States
- 3Department of Plant Sciences, University of Tennessee, Knoxville, TN, United States
Introduction: Promoting sustainable crop production is enhanced by an effective method to assess soil health. However, soil health assessment is challenging due to multiple interactions among dynamic soil properties (i.e., soil health indicators) across management practices and agroecological regions. We tested several currently popular soil health assessment methods for cropping systems in Tennessee in the southeastern US and found that these methods failed to differentiate Tennessee soil health under long-term conservation and conventional management.
Materials and methods: This study developed a Tennessee weighted soil health index (WSHI) by: 1) selecting a set of management-sensitive soil health indicators, 2) assigning meaningful weights to indicators, and 3) normalizing the scores based on regionally relevant undisturbed natural reference sites. The tested cropping systems treatments were moldboard plow (MP) in continuous soybean (SS), no tillage (NT) in SS, NT with wheat cover (NTW) in SS, no cover and chisel plow (NCCT) in continuous cotton (CC), no cover and no tillage (NCNT) in CC, and hairy vetch cover and no tillage (VCNT) in CC. In addition, two woodlots and one grassland sites in the vicinity of the cropping systems were selected to represent undisturbed natural systems.
Results and discussion: Out of 22 indicators that proved to be management-sensitive, six were selected as a minimum dataset (MDS). These were particulate organic matter C (POM-C), soil respiration from 4-day incubation (4d CO2), small macroaggregate (0.250-2mm)-associated C (SMA-C), surface hardness (PR15), microbial biomass N (MBN), and bulk density (BD). Measured values of the MDS indicators were transformed into unitless normalized scores (based on the regional range of the indicator), and finally integrated into WSHI scores using a weighted-addition approach. Additionally, the soil health gap (SHG) between the soil health of the regional reference system and different cropping systems was calculated. Results revealed that WSHI strongly differentiated soil health between long-term conservation and conventional managements practices. The WSHI scores for southeastern cropland soils varied as follows: VCNT = NTW > NT > NCNT ≥ NCCT ≥ MP. The SHGs under MP, NCCT, NCNT, NT, NTW, and VCNT were 85.5, 79.9, 68, 45.1, 25.2, and 24.3, respectively, relative to the average WSHI of three undisturbed systems. Results showed that the WSHI approach is effective in more meaningful regional assessment of soil health and SHG can be a potential metric for comparing soil health across agroecological regions.
Introduction
Healthy soils perform an array of ecosystem services and are resilient to natural and anthropogenic disturbances (1–3). Therefore, improving soil health is key for ensuring agricultural sustainability (4, 5). Adoption of conservation agricultural management practices (e.g., reduced or no tillage, cover crops, crop rotations, etc.) have been shown to improve soil functions such as nutrient cycling, soil aggregation, and overall soil health as compared to conventional practices (e.g., intensive tillage, monoculture, etc.) (6–10). However, the extent of soil health improvement or degradation in response to management depends on the agroecological region with its specific climatic and edaphic characteristics (1, 11). This region-specificity can have more impact on soil health than differences in agricultural management practices. Therefore, despite the pivotal role of healthy soils in building sustainable production systems, a standardized universal method of soil health measurement remains challenging and is currently under active debate (12–17).
Several soil health assessment approaches currently exist, including the general soil management assessment framework (SMAF) (18), and the more specific Haney soil health test (HSHT) (19, 20), comprehensive assessment of soil health (CASH) (21–23), Saskatchewan assessment of soil health (SASH) (24), and Alabama soil health index (ASHI) (25). Although these methods were developed to target specific agroecological regions (i.e., HSHT for Texas, CASH for New York, and ASHI for Alabama), their uses in other regions have been reported in recent years. Most of those studies revealed that the region-specificity of these tests limits the applicability across regions due to differences in major soil types, cropping systems, and climatic factors. For example, CASH showed no soil health response to long-term management when applied to the hot-humid southeastern US (14, 16, 26, 27), and HSHT showed the same results in humid-temperate (Canada) and hot-humid (southeastern US) regions (14, 28–31). Recent research also revealed lack of sensitivity of HSHT, CASH, and ASHI to differentiate soil health in response to long-term conservation management from conventional management in Tennessee cropping systems (27, 31). Therefore, this study aimed to develop an improved soil health index framework specific for Tennessee croplands to discern differences in soil health under different soil management, especially differentiating between tillage-based and conservation systems.
A weighted approach for developing soil health index is considered promising in explaining relationships among soil functions, soil properties (soil health indicators), and soil health scores, as the weight assigned to a soil health indicator is based on the measured variability and relative importance of that particular indicator within a suite of indicators (32–34). This process involves the following steps: (a) selection and measurement of potential soil health indicators, (b) determination of a minimum dataset (MDS) using multivariate statistical methods such as principal component analysis (PCA), (c) scoring of indicators using scoring functions calibrated to the measured regional range of soil health indicators, (d) assignment of a weight to each indicator with a variance-based method, and (e) integration of indicators into a soil health score by a weighted-addition method (18, 35, 36).
Because of the reported region-specificity in soil health response to management, a set of reference or benchmark values to set upper and lower boundaries for regional soil health is helpful to evaluate whether management practices indeed changed soil health. An undisturbed or uncultivated native soil in the vicinity of the croplands can be considered as a reference for the upper bound of soil health (12, 37, 38). Similarly, a very disturbed or highly managed site can be considered as the lower bound of soil health in the region. This way of calibrating scoring functions for soil health assessment has been suggested by several past studies (15, 18, 38). This approach of determining soil health scores is particularly relevant for the southeast US region, including Tennessee, to avoid the over- or under-estimation of soil health seen in using available methods such as HSHT, CASH, and ASHI. For example, soil organic carbon (SOC) content in southeast US soils is generally lower than the soils in the Midwest and Northeast regions (39, 40). This means that the SOC scoring functions in CASH-developed using soils predominantly from the Northeast region-can underestimate the potential of conservation management in building SOC in the cropland soils of Tennessee. Similarly, use of scoring functions developed predominantly from relatively degraded soils-as in the case of the ASHI test-can overestimate the soil health of degraded soils in Tennessee. Both over- and under-estimation of soil health scenarios were evident when we applied CASH and ASHI for croplands of Tennessee (27). We found that all long-term conventional and conservation management treatments showed low to medium soil health based on CASH and medium to high soil health based on ASHI. Therefore, a realistic soil health assessment of specific cropping systems and agroecological regions requires a method that takes into account region-specific upper and lower bounds of soil health (41). This study aimed to develop a weighted soil health index framework for row cropping systems of Tennessee using regionally relevant upper and lower bounds of soil health and a regionally-sensitive set of soil health indicators. We hypothesized that our weighted soil health index will be able to discern the soil health of Tennessee cropping systems in response to management differences.
Materials and methods
Study sites description and treatments
Soil samples for this study were collected from two ongoing long-term agricultural field experiments [continuous soybean (Glycine max L.), SS and continuous cotton (Gossypium hirsutum L.), CC] and three undisturbed sites (two woodlots and one grassland) located in west Tennessee on silt loam soils. The region experiences a 30-year mean annual temperature of 15.6 °C and a mean annual rainfall of 1375 mm. Detailed description of the treatments and management of SS and CC studies can be found in Table 1 of Singh et al. (31), and a brief summary is included below. Three undisturbed and uncultivated sites - (i) Jackson woodlot (JW), Milan woodlot (MW), and Milan grassland (MG) - were selected within the region to represent relatively “natural undisturbed” soil conditions. These sites did not receive any external inputs for past several decades and have no known history of agricultural activities. These undisturbed natural sites were considered as benchmark or reference sites to represent the upper bound of regional soil health as described in (12, 38).
Continuous soybean study
This study began in 1979 at the University of Tennessee’s West Tennessee Research and Education Center (WTREC) in Jackson, TN (35°37’ N, 88°50’ W; elevation 125 m). The soil at the site is classified as a well-drained Lexington series (fine-silty, mixed, thermic, Ultic Hapludalfs) on a 0 to 2 percent slope. Each experimental unit was 18 m x 6 m and contained eight rows of soybeans. This study includes six treatments with four replications in a completely randomized design. The treatments are: (i) moldboard plowing to 25-cm depth followed by disking and harrowing (MP); (ii) chisel plowing to 20-cm depth followed by harrowing (CP); (iii) disc plowing to 10-cm depth followed by harrowing (DP); (iv) no tillage (NT); (v) NT with a winter wheat (Triticum aestivum L.) cover crop (NTW); and (vi) NT with wheat-soybean double cropping (NTWD). In the tilled treatments (MP, CP, and DP), tillage and harrowing operations were generally performed in late May before soybean planting. In the NTW system, wheat was planted as a cover crop after harvesting soybean in October-November, and the cover crop was chemically terminated using 0.71 kg ha-1 paraquat (1-methyl-4-(1-methylpyridin-1-ium-4-yl) pyridin-1-ium) two to three weeks prior to planting soybean in April-May. From this long-term study, we considered only MP, NT, and NTW treatments. The MP treatment represents the most intensive agricultural management, thus considered to set the lower bound of regional soil health. The plots were maintained following the standard fertilizer recommendations of the University of Tennessee. All plots were treated with 3.36 kg ha-1 alachlor (2-Chloro-N-(2,6-diethylphenyl)-N-(methoxymethyl)acetamide) and 0.42 kg ha-1 metribuzin (4-Amino-6-tert-butyl-3-methylsulfanyl-1,2,4-triazin-5-one) for pre-emergence weed suppression and 0.13 kg ha-1 clethodim (2-[1-[[(E)-3-chloroprop-2-enoxy] amino] propylidene]-5-(2-ethylsulfanylpropyl) cyclohexane-1,3-dione) for post-emergence weed control.
Continuous cotton study
This study began in 1981 at the same location as the SS study but under continuous cotton production. The size of each experimental unit was 12 m x 8 m with eight rows of cotton. The experimental design was Randomized Complete Block Design (RCBD) with split-split plot treatment arrangement and four replications. The main plot treatment was four levels of N rates: 0 kg ha-1 (0N), 34 kg ha-1 (34N), 67 kg ha-1 (67N), and 101 kg ha-1 (101N). The sub-plots were four cover crop treatments: winter wheat (W), hairy vetch (Vicia villosa Roth.) (HV), crimson clover (Trifolium incarnatum L.), and no cover crop (NCC). The sub-sub plots were two levels of tillage: chisel tillage (CT) and no tillage (NT). A sub-set of treatments were selected for the present study including: (i) no cover crop with chisel tillage (NCCT), (ii) no cover crop with no tillage (NCNT), and (iii) hairy vetch cover crop with no tillage (VCNT). Chisel tillage was done twice to 10-cm depth followed by roller harrow leveling to smooth the surface before planting cotton in May. The cover crops were chemically terminated in late April to early May of each year using 3.51 L ha−1 of Gramoxone® SL. According to the University of Tennessee recommendation, P fertilizer (triple superphosphate) was applied at 101 kg P2O5 ha−1, and K fertilizer (muriate of potash) was applied at 134 kg K2O ha−1.
Soil sampling
In January 2020, replicated (n=4) soil samples were collected from all treatments. Approximately, 10-15 random cores were collected from each replicated treatment (plot) at a depth of 0-15 cm using a sampling probe of 2.5-cm diameter. These cores were combined and homogenized to make a composite soil sample. Additionally, four cores of a 5-cm diameter and 15-cm length were collected from each treatment for bulk density (BD) measurements.
Quantification of soil health indicators
Soil analysis
Soil samples were processed and analyzed for several physical, chemical, and biological indicators. These indicators were selected based on several available soil health assessment methods (e.g., CASH, HSHT, ASHI, etc.) and previous studies conducted in the region. The soil physical indicators were surface and subsurface hardness (PR15 and PR45, respectively) measured using a penetrometer (Soil compaction tester penetrometer, Dickey-john corporation, Illinois, USA) (42), wet aggregate stability (WAS) measured using a wet sieving apparatus (Eijkelkamp Agrisearch Equipment, Giesbeek, Netherlands) (43), soil texture measured using the hydrometer method (44), gravimetric soil moisture determined on oven-dry basis (45), and BD measured using the core method (46). Soil biological indicators were the soil protein index (SPI) (47, 48), soil respiration from 4-day incubation (4d CO2) using potassium hydroxide (KOH) trap method (49), permanganate oxidizable C (POXC) (50), soil respiration measured by Solvita® gel method (1d CO2-C) (51), Solvita® labile amino N (SLAN) (Brinton (52), soil organic C (SOC) measured by dry combustion at 950 °C using a CN analyzer (Elementar vario TOC cube in solid mode, Hanau, Germany), water extractable C (WEC) and N (WEN) (53), potential mineralizable N (PMN) based on 7-day anaerobic incubation (54), microbial biomass C (MBC) and N (MBN) using chloroform fumigation method (55, 56), activities of four C-acquiring extracellular enzymes (α-glucosidase (AG), β-glucosidase (BG), cellobiohydrolase (CBH), and β-xylosidase (XYL)), one P-acquiring enzyme (phosphatase; PHOS), and one N-acquiring enzyme (N-acetyl glucosamine; NAG) (57), and density fractionation of soil to separate particulate organic matter C (POM-C) and mineral-associated organic C (MAOC) using sodium polytungstate solution at a density of 1.6 Mg m−3 (58). The soil chemical indicators were soil pH measured on a 1:1 soil:water (v/v) suspension, Mehlich-1 extractable macro- and micro-nutrients (P, K, Mg, Fe, Mn, and Zn) analyzed by Inductively Coupled Plasma-Optical Emission Spectrometer (ICP-OES) (59), and ammonium N (NH4-N) and nitrate N (NO3-N) using 2-M potassium chloride (KCl) extraction followed by measurement on a Skalar Continuous Flow Analyzer (60).
Aggregate analysis
Aggregate size distribution was determined using dry sieving method by placing 100 g of air-dried and 8-mm sieved soil sample on top of a stack of sieves of sizes 2, 0.25 and 0.053 mm, and shaken using a vertical sieve shaker apparatus (CSC sieve shaker, Fairfax, VA) for 5 min at an amplitude of 0.1 mm. Aggregates were fractionated into four size classes: > 2 mm (large macroaggregates, LMA), 0.25-2 mm (small macroaggregates, SMA), 0.053-0.25 mm (microaggregates, MiA), and < 0.053 mm (clay- and silt-size particles, CSP). Aggregate size distribution was calculated by weighing aggregates retained on top of each sieve and expressing as a fraction of the initial amount of sample used. The mean weight diameter (MWD) was calculated using equation (1) (61):
where xi is the mean diameter of aggregates size fraction on each sieve (mm), wi is the mass of aggregates retained on each sieve, and n is the number of aggregate size fractions. After aggregate size separation, aggregate-associated SOC concentration (g kg−1 aggregates) in each aggregate size class was determined by dry combustion using a CN analyzer (Elementar vario TOC cube in solid mode, Hanau, Germany). Aggregate-associated C fractions were classified into four categories: large macroaggregate-associated C (LMA-C), small macroaggregate-associated C (SMA-C), microaggregate-associated C (MiA-C), and clay- and silt-size particles-associated C (CSP-C) (62).
Statistical analysis
Analysis of variance (ANOVA) was conducted using the PROC GLIMMIX procedure in SAS v9.4 statistical package (63) for individual soil health indicators based on a completely randomized design. Treatments were considered as fixed effects and replicates were considered as random effects in the model. Least square means were separated using the Least Significant Difference (LSD) at p < 0.05 to determine treatment response to each indicator. To identify a minimum data set (MDS) of indicators, only those indicators that responded statistically (p < 0.05) to at least one of the treatments were selected for PCA (34), which resulted in 22 indicators. These 22 indicators were subjected to PCA using OriginPro® software to calculate the individual indicator weight and relationship among indicators. Based on the PCA scree plot (point of inflection), four principal components (PC) were selected. Within each PC, the indicator with the highest eigenvector value was selected for the MDS. Also, if there were other indicators in each PC with eigenvector values within ±10% of the highest eigenvector values, those were also included in the MDS (34, 64). After this step, in case there was more than one indicator retained within a PC, correlation analysis was conducted using PROC CORR procedure in SAS (r > 0.75, p < 0.05) to eliminate redundant variables showing stronger autocorrelations and lower eigenvector values (64–67). Finally, the MDS was comprised of six indicators (POM-C, 4d CO2, SMA-C, PR15, MBN, and BD).
The next step was to transform the six measured indicator values to indexed indicator scores on a scale of 0 to 100 using cumulative normal distribution functions (18, 48, 64). The POM-C, 4d CO2, SMA-C, and MBN were scored using “more is better” approach, and PR15 and BD were scored using “less is better” approach (18, 66). In these scoring functions, for an individual indicator, the lower and upper limits of the curve were based on the regionally-derived lower and upper limits of that particular indicator. Thus, these scoring functions represent the region-specific ranges of soil health indicators (64, 67). For example, POM-C cumulative normal distribution curve (range 0-100) was created using standard deviation, mean, and range of POM-C measured values (0.518-3.32 mg kg-1). Equation derived from the cumulative normal distribution curve was used as a scoring function to convert measured values to unitless scores. After transforming the selected indicators into unitless indexed scores, the variance-based weighting factors generated from PCA were assigned to each indicator. The weighting factor was calculated as a fraction of the proportion of variance accounted for by each PC and the total cumulative variance of all the selected PCs (29, 68). In each PC, all selected indicators were assigned the same weight, determined by dividing the weighting factor of that PC by the total number of indicators selected in that PC (34). A weighted score of individual indicators was determined as the product of the indexed indicator score (0-100) and the assigned weight. Finally, a weighted soil health index (WSHI) score was calculated by adding weighted scores of all selected indicators based on equation 2 (29, 67, 69).
Where, n = number of indicators in MDS, Wi = assigned weight of individual indicators, and Qi = indexed score of individual indicators.
Results and discussion
Minimum dataset for soil health assessment
From the PCA with a total of 22 indicators (15 indicators derived from soil and 7 indicators derived from aggregates), four PCs were selected that accounted for 82.5% of the cumulative variance in the dataset, with the first two PCs (PC1 and PC2) accounting for 73% of the variance (Table 1). After conducting the indicator selection steps within each PC, the following indicators were retained: POM-C and 4d CO2 in PC1, SMA-C in PC2, PR15 in PC3, and BD and MBN in PC4 (Table 1). So, the final MDS included POM-C, 4d CO2, SMA-C, PR15, MBN, and BD indicators.

Table 1 Eigenvectors of soil health indicators used in the principal component analysis for developing minimum dataset.
The POM-C, reservoir of labile C pool and primary energy source for microorganisms, mainly consists of partially decomposed plant materials. This functional C pool is widely recognized as more responsive to management than is total SOC (70–74). Soil respiration, measured based on 4-day incubation of rewetted dry soil and capturing CO2 in KOH solution (4d CO2), has also been used as a very sensitive indicator of soil health differences among management practices (48, 75–77). Since agricultural management practices affect soil aggregation and C protection in aggregates (78–80), aggregate-associated C fractions can serve as an early indicator for SOC changes in bulk soil. In this study, C protected in small macroaggregates (SMA) was found to be more sensitive than C protected in other aggregate-sizes (67). Soil physical properties such as bulk density (BD) and penetration resistance (PR) have also been emphasized as indicators for soil health assessment because of their role in deciding soil physical conditions for supporting plants (18). Consistent with our finding, many other studies in the southeastern US region have also reported management-sensitivity of indicators such as POM-C (81), 4d CO2 (14, 17), SMA-C (62), PR15 (82, 83), BD (82–84), and MBN (84).
Response of indicators, indicator scores, and soil health scores to management practices
Measured values of all the indicators in the MDS varied significantly among treatments. Undisturbed natural systems (Jackson Woodlot, JW; Milan Grassland, MG; Milan Woodlot MW) showed consistently better soil health indicator values than the cropping systems (Table 2). A better response among cropping system treatments was observed when undisturbed natural systems were excluded from the model. This is attributed to the greater magnitude of weighted scores under undisturbed natural systems and associated standard deviation of means, as reported by Williams et al. (85). Among cropping system treatments, the POM-C results showed MP < NCCT < NCNT = NT < NTW = VCNT. Undisturbed natural systems showed higher 4d CO2 than the cropping systems. Among the cropping systems, 4d CO2 was higher under NT, NTW, and VCNT compared to MP, NCCT, and NCNT treatments.
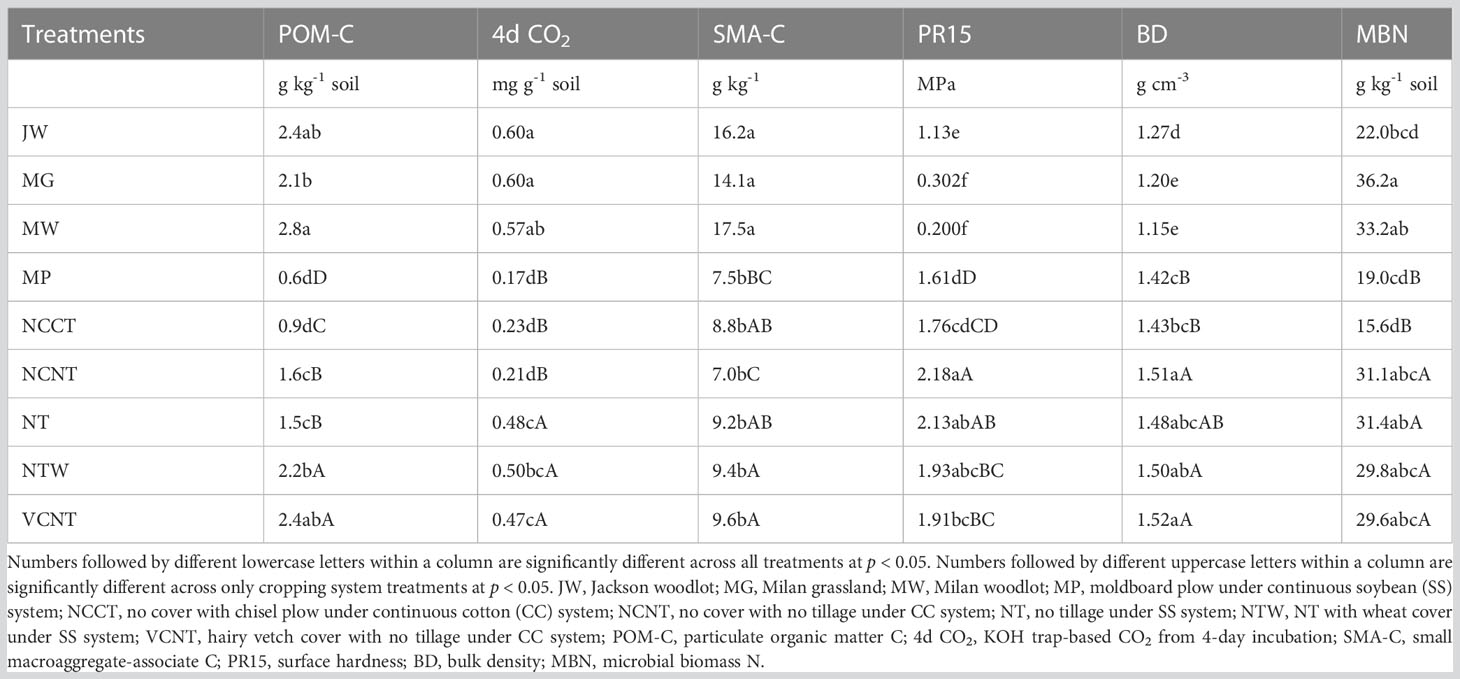
Table 2 Response of measured values of indicators included in the minimum dataset under different treatments.
Similar to POM-C and 4d CO2, SMA-C was also higher in undisturbed natural systems than in cropping systems. However, when undisturbed natural systems were excluded, NTW and VCNT showed higher SMA-C than MP and NCNT. Statistically, however, SMA-C was the lowest for both MP and NCNT treatments, and MBN was the lowest for both MP and NCCT. Undisturbed natural systems showed lower surface penetration resistance (PR15) and BD than cropping systems. Among the cropping systems, higher PR15 and BD were observed under no-tilled treatments (VCNT, NTW, NT, and NCNT) than tilled treatments (MP and NCCT). The MBN values were greater and nearly similar for undisturbed and NT sites as compared to tilled sites. Among cropping systems, almost all indicators showed numerically the lowest measured values under MP treatment.
Higher levels of POM-C, 4d CO2, SMA-C, and MBN under undisturbed natural systems compared to cropping systems-and under long-term no-tilled systems compared to tilled systems-can be attributed to less soil disturbance in undisturbed natural and no-tilled systems compared to tilled systems, and high organic matter inputs in undisturbed natural systems and cover cropped cropping systems. In cropping systems, cover crops (e.g., hairy vetch and wheat) add more above-and below-ground biomass to soil (86–88), increasing C accumulation and stimulating microbial growth and activity. Several recent studies conducted on Tennessee croplands reported the response of one or more indicators included in our MDS to management practices. For example, Mbuthia et al. (84) reported enhanced MBN under hairy vetch cover crop treatment and BD as an overall key soil health indicator in continuous cotton (CC) system. Also, BD under CC and PR15 under continuous soybean (SS) systems showed similar differences among treatments in Nouri et al. (83) and Nouri et al. (82). In addition, an increase in SMA-C under NTW and NT as compared to MP treatment in the SS system was reported by Singh et al. (62). Similar soil properties also showed improved responses in no-tilled and cover cropped systems compared to tilled and fallow systems in other agroecological regions (89–93).
The measured values of MDS indicators were transformed into unitless scores (indexed scores) using “more is better” or “less is better” scoring functions. Out of all the indicators in the MDS, the highest weighting factor (0.36) was assigned to indicators in PC1 (POM-C and 4d CO2), as PC1 accounted for the greatest proportion of variance among selected PCs (Table 1). Weighting factors of 0.165, 0.063, and 0.054 were assigned to indicators in PC2 (SMA-C), PC3 (PR15), and PC4 (BD and MBN), respectively. Thus, the relative contribution of individual indicators in overall weighted soil health index (WSHI) were 36, 36, 16.5, 6.3, 2.6, and 2.6 for POM-C, 4d CO2, SMA-C, PR15, BD, and MBN, respectively. Weighted scores for individual indicators (product of indexed scores and weight) varied among management practices when comparisons were made with and without undisturbed natural systems (Table 3). Overall, weighted scores of MDS indicators followed a nearly identical trend to measured indicator values (Table 2) under different managements. Among all treatments, undisturbed natural systems generally showed higher weighted scores for most indicators than cropping system treatments. Among cropping system treatments, weighted scores of POM-C, 4d CO2, SMA-C, and MBN were greater under no-tilled treatments (i.e., NTW and VCNT) than under tilled treatments (i.e., MP and NCCT) (Table 3). However, weighted scores of PR15 and BD were relatively higher under tilled treatments despite no statistical difference between the two tilled treatments. One exception to this was PR15, which was higher under MP than NCCT. Among SS treatments (MP, NT, and NTW), weighted indicator scores for all indicators were lower for the intensive MP tillage. Among CC treatments (NCCT, NCNT, and VCNT), weighted scores of all indicators were the lowest for NCCT.
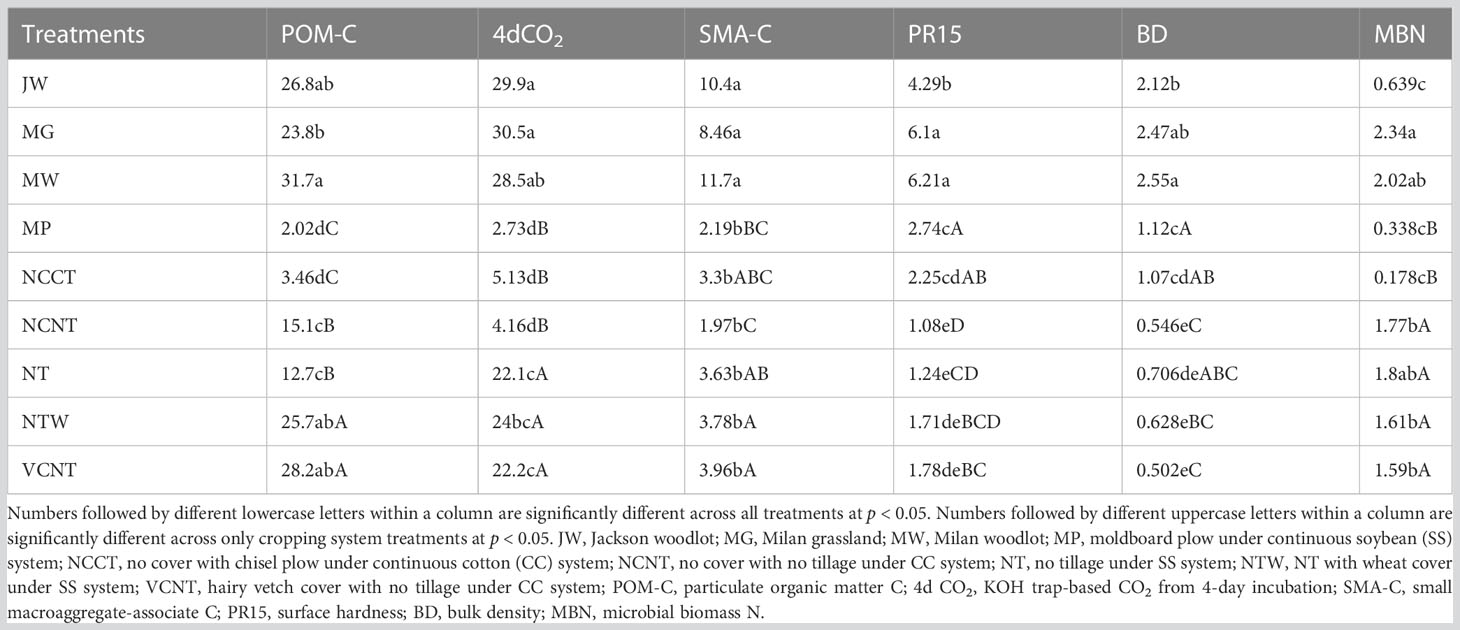
Table 3 Response of indexed score values of indicators included in the minimum dataset under different treatments.
The relative WSHI scores were calculated by assigning the maximum WSHI score of 100 to the MW system because MW had the highest absolute WSHI score of 83 (sum of weighted scores of indicators in MDS, Table 3). The WSHI scores of MW did not vary from other undisturbed natural systems (JW, and MG), but WSHI scores for all undisturbed natural systems were higher than those of cropping system treatments (Figure 1). The intensively tilled MP treatment received the lowest WSHI score, but it was not significantly different from scores of NCCT and NCNT systems when undisturbed natural systems were included in the model. When only the cropping systems were compared, VCNT and NTW showed greater WSHI scores than other treatments. Overall, WSHI scores varied as follows: VCNT (70.3) = NTW (69.5) > NT (51) > NCNT (29.7) ≥ NCCT (18.6) ≥ MP (13.5). The treatment response of WSHI scores were consistent with the treatment response of individual indicators (Tables 2, 3).
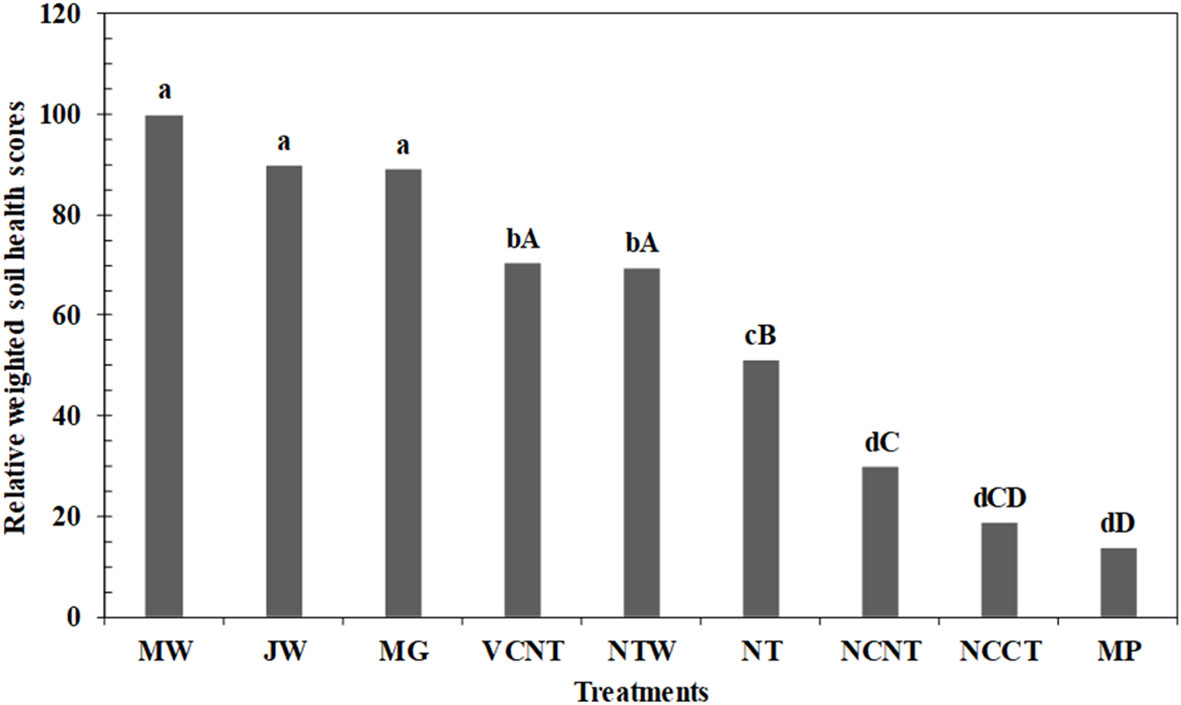
Figure 1 Relative weighted soil health index (WSHI) scores under different cropping and undisturbed natural systems. Different lowercase letters denote significantly different across all treatments at p < 0.05. Different uppercase letters denote significantly different across only cropping system treatments at p < 0.05. MW, Milan woodlot; JW, Jackson woodlot; MG, Milan grassland; VCNT, hairy vetch cover with no tillage under continuous cotton (CC) system; NTW, no tillage with wheat cover under continuous soybean (SS) system; NT, no tillage under SS system; NCNT, no cover with no tillage under CC system; NCCT, no cover with chisel plow under CC system; MP, moldboard plow under continuous SS system.
The multivariate analysis combined with the weighted scoring approach we used for quantitative soil health evaluation has been used in many past studies for a wide range of managements (94–96). Many such studies revealed that the weighted approach could discern more reasonable interrelationships among indicators and generate a more sensitive overall soil health index that distinguishes management differences (33, 34, 95, 97). Although the region-specific determination of MDS and the consequent indicator weighting process used in our study is applicable to the cropland soils in west Tennessee, this framework of generating MDS and WSHI could easily be adapted to other regions and cropping systems. However, adoption of this process and framework could lead to different set of indicators, MDS, and scoring functions for different regions as compared to this study. In addition, there are some potential caveats and limitations associated with this approach such as: (i) This approach is somewhat limited by the availability of long-term field studies and undisturbed natural soils for testing and finding suitable soil health indicators; (ii) In some cases, natural undisturbed soils could show lower soil health scores. For e.g., human inputs, especially water and nutrients, in an arid or desert region. In this case, values of soil health indicators could be higher than that of natural undisturbed soils, therefore this could show higher soil health scores for managed systems (41). This could further complicate the interpretation of the soil health indicators and scores under different management. Despite these caveats and limitations, this approach provides the much-anticipated insights into conservation management practices and soil health and can be used as a tool to promote healthy soils.
Soil health gap
Due to the region-specificity of soil health assessment, the need to account for regional reference or benchmark soil health is obvious. Since historical intensive soil management led to the deterioration of soil health (98), assessing the soil health gap (SHG) between cropping system management and a nearby undisturbed natural system could more meaningfully quantify the magnitude of soil health degradation/improvement under specific management (38). Soil health gap, a concept similar to extensively used “yield gap”, can be utilized as a universal standard to assess the performance of conservation management practices to build soil health. Additionally, SHG can provide a realistically achievable regional soil health goal when conventional systems are transitioned to more sustainable systems by adopting conservation practices (38). The SHGs, calculated as the difference between the WSHI score of undisturbed natural system and cropping system treatments, in the present study are presented in Figure 2. Since WSHI scores among the three undisturbed natural systems were similar, we averaged WSHI scores of all three undisturbed natural systems and assigned a maximum score of 100 to the undisturbed natural system. The SHGs under MP, NCCT, NCNT, NT, NTW, and VCNT were 85.5, 79.9, 68, 45.1, 25.2, and 24.3, respectively (Figure 2). Higher SHG under MP is expected and it reiterates the degraded soil health due to 41 years of intensive MP tillage in a soybean monoculture system. This also demonstrates a great opportunity for soil health improvement in heavily tilled monoculture cropping systems. On the other hand, long-term no tillage combined with a cover crop (NTW, VCNT) brought soil health closer to the natural sites. Use of SHG for regional soil health assessment and as a potential universal soil health index deserves more attention as the SHG concept can address multiple ongoing challenges in soil health assessment due to differences in indicator selection, analytical protocols, soil types, climates, and conservation management practices.
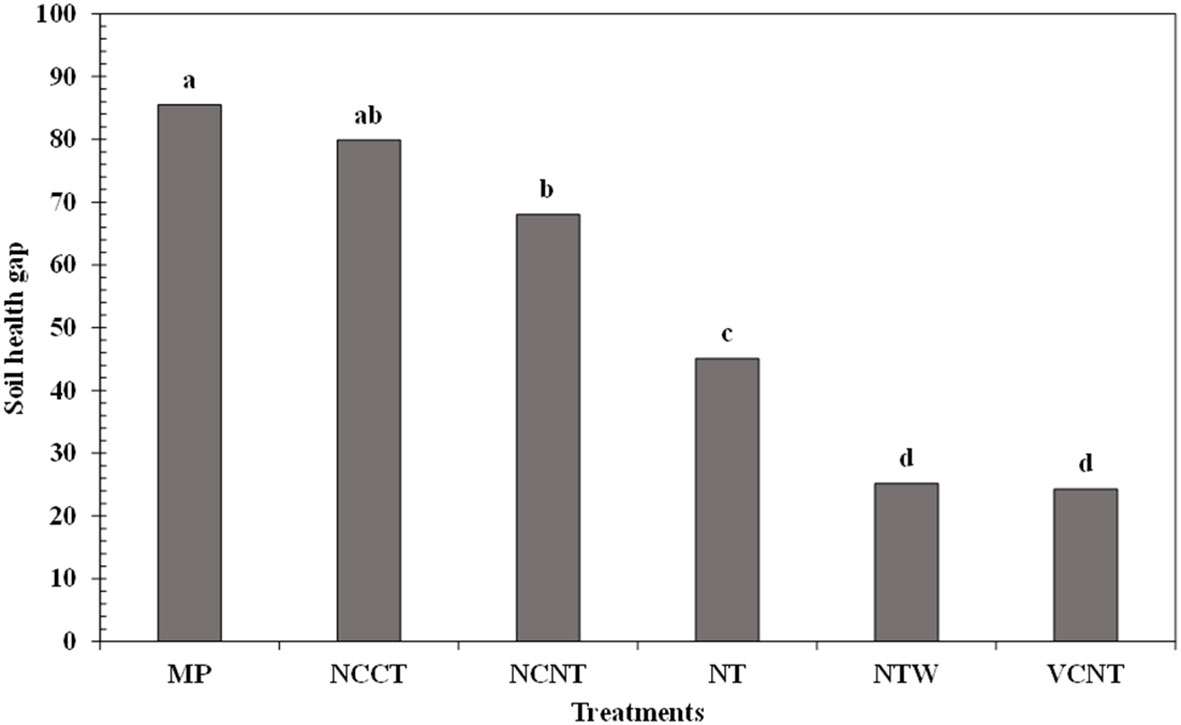
Figure 2 Soil health gap (SHG) of agricultural systems under different managements in relation to the three natural undisturbed systems. Different lowercase letters denote significant differences across treatments at p < 0.05. MP, moldboard plow under continuous soybean (SS) system; NCCT, no cover with chisel plow under continuous cotton (CC) system; NCNT, no cover with no tillage under CC system; NT, no tillage under SS system; NTW, no tillage with wheat cover under SS system; VCNT, hairy vetch cover with no tillage under CC system.
Conclusions
This study developed a refined regional soil health assessment by utilizing a weighted soil health index (WSHI) approach and regional undisturbed natural systems as benchmark soils. This approach under a multivariate framework showed promise in effectively discerning soil health differences among various conservation and conventional managements in the tested cropping systems. Though we proposed a region-specific approach, this process of deriving WSHI can easily be adapted to other regions and cropping systems. Further, the soil health gap (SHG) concept applied in this study revealed the extent of degradation of soil health under intensive cropping systems management practices and showed promise to be used as a standardized tool to assess and compare soil health across agroecological regions.
Data availability statement
The original contributions presented in the study are included in the article/supplementary material. Further inquiries can be directed to the corresponding author.
Author contributions
SS: Data collection, analysis, writing original draft, editing. SJ: conceptualization, funding, reviewing, and editing. DY: conceptualization, reviewing, and editing. XY: reviewing and editing. FW: reviewing and editing.
Funding
This research was funded by Tennessee Department of Agriculture (A20-0337) and USDA Hatch Grant (TN00569).
Acknowledgments
The authors would like to thank personnel at the University of Tennessee’s West Tennessee Research and Education centers at Jackson and Milan, TN for managing the field trials and helping with sample collection.
Conflict of interest
The authors declare that the research was conducted in the absence of any commercial or financial relationships that could be construed as a potential conflict of interest.
The authors SJ and XY declared that they were editorial board members of Frontiers, at the time of submission. This had no impact on the peer review process and the final decision.
Publisher’s note
All claims expressed in this article are solely those of the authors and do not necessarily represent those of their affiliated organizations, or those of the publisher, the editors and the reviewers. Any product that may be evaluated in this article, or claim that may be made by its manufacturer, is not guaranteed or endorsed by the publisher.
References
1. Karlen D, Andrews S, Doran J. Soil quality: current concepts and applications. Adv Agron (2001) 74:1–40. doi: 10.1016/S0065-2113(01)74029-1
2. Karlen DL, Ditzler CA, Andrews SS. Soil quality: why and how? Geoderma (2003) 114(3-4):145–56. doi: 10.1016/S0016-7061(03)00039-9
3. Kibblewhite M, Ritz K, Swift M. Soil health in agricultural systems. Philos Trans R Soc B: Biol Sci (2007) 363(1492):685–701. doi: 10.1098/rstb.2007.2178
4. Lal R. Soil health and climate change: an overview, Soil health and climate change. Berlin, Heidelberg: Springer (2011) p. 3–24.
5. Nakajima T, Lal R, Jiang S. Soil quality index of a crosby silt loam in central Ohio. Soil Till. Res (2015) 146:323–8. doi: 10.1016/j.still.2014.10.001
6. Al-Kaisi M, Douelle A, Kwaw-Mensah D. Soil microaggregate and macroaggregate decay over time and soil carbon change as influenced by different tillage systems. J Soil Water Conserv (2014) 69(6):574–80. doi: 10.2489/jswc.69.6.574
7. Blanco-Canqui H, Francis CA. Building resilient soils through agroecosystem redesign under fluctuating climatic regimes. J Soil Water Conserv (2016) 71(6):127A–33A. doi: 10.2489/jswc.71.6.127A
8. Lal R. Beyond COP 21: potential and challenges of the “4 per Thousand” initiative. J Soil Water Conserv (2016) 71(1):20A–5A. doi: 10.2489/jswc.71.1.20A
9. Wegner BR, Chalise KS, Singh S, Lai L, Abagandura GO, Kumar S, et al. Response of soil surface greenhouse gas fluxes to crop residue removal and cover crops under a corn–soybean rotation. J Environ Qual. (2018) 47:1146–54. doi: 10.2134/jeq2018.03.0093
10. Chalise KS, Singh S, Wegner BR, Kumar S, Pérez-Gutiérrez JD, Osborne SL, et al. Cover crops and returning residue impact on soil organic carbon, bulk density, penetration resistance, water retention, infiltration, and soybean yield. Agron J (2019) 111(1):99–108. doi: 10.2134/agronj2018.03.0213
11. Wienhold BJ, Andrews S, Karlen D. Soil quality: a review of the science and experiences in the USA. Environ. Geochem. Health (2004) 26(2):89–95. doi: 10.1023/B:EGAH.0000039571.59640.3c
12. Bünemann EK, Bongiorno G, Bai Z, Creamer RE, De Deyn G, de Goede R, Fleskens L, Geissen V, Kuyper T.W, Mäder P and Pulleman M. Soil quality–A critical review. Soil Biol Biochem (2018) 120:105–25. doi: 10.1016/j.soilbio.2018.01.030
13. Larkin RP. Soil health paradigms and implications for disease management. Annu Rev Phytopathol (2015) 53:199–221. doi: 10.1146/annurev-phyto-080614-120357
14. Roper WR, Osmond DL, Heitman JL, Wagger MG, Reberg-Horton SC. Soil health indicators do not differentiate among agronomic management systems in north carolina soils. Soil Sci Soc Am J (2017) 81(4):828–43. doi: 10.2136/sssaj2016.12.0400
15. Rinot O, Levy GJ, Steinberger Y, Svoray T, Eshel G. Soil health assessment: A critical review of current methodologies and a proposed new approach. Sci Total Environ (2019) 648:1484–91. doi: 10.1016/j.scitotenv.2018.08.259
16. Roper WR, Osmond DL, Heitman JL. A response to “Reanalysis validates soil health indicator sensitivity and correlation with long-term crop yields”. Soil Sci Soc Am J (2019) 83(6):1842–5. doi: 10.2136/sssaj2019.06.0198
17. van Es HM, Karlen DL. Reanalysis validates soil health indicator sensitivity and correlation with long-term crop yields. Soil Sci Soc Am J (2019) 83(3):721–32. doi: 10.2136/sssaj2018.09.0338
18. Andrews SS, Karlen DL, Cambardella CA. The soil management assessment framework. Soil Sci Soc Am J (2004) 68(6):1945–62. doi: 10.2136/sssaj2004.1945
19. Haney R, Brinton W, Evans E. Soil CO2 respiration: Comparison of chemical titration, CO 2 IRGA analysis and the Solvita gel system. Renew. Agric Food Syst (2008) 23(02):171–6. doi: 10.1017/S174217050800224X
20. Haney RL, Haney EB, Smith DR, Harmel RD, White MJ. The soil health tool—Theory and initial broad-scale application. Appl Soil Ecol (2018) 125:162–8. doi: 10.1016/j.apsoil.2017.07.035
21. Gugino BK, Idowu OJ, Schindelbeck RR, van Es HM, Wolfe DW, Moebius BN, et al. Cornell soil health assessment training manual Cornell university. Geneva, NY. (2007).
22. Schindelbeck RR, van Es HM, Abawi GS, Wolfe DW, Whitlow TL, Gugino BK, et al. Comprehensive assessment of soil quality for landscape and urban management. Landsc Urban Plan. (2008) 88(2):73–80. doi: 10.1016/j.landurbplan.2008.08.006
23. Idowu O, Van Es H, Abawi G, Wolfe D, Schindelbeck R, Moebius-Clune B, et al. Use of an integrative soil health test for evaluation of soil management impacts. Renew. Agric Food Syst (2009) 24(03):214–24. doi: 10.1017/S1742170509990068
24. Wu Q, Congreves KA. A soil health scoring framework for arable cropping systems in Saskatchewan Canada. Can J Soil Sci (2021), 102(2):341–356. doi: 10.1139/cjss-2021-0045
25. Bosarge T. A soil quality index for alabama (2015). Auburn, AL: Auburn University. Available at: https://etd.auburn.edu/handle/10415/4854 (Accessed 11/22/2022).
26. Birri R. Assessing the efficacy of enzyme assays as a soil health indicator on diverse, long-term, agronomic plots (2020). The Ohio State University. Available at: https://core.ac.uk/download/pdf/305123716.pdf (Accessed /22/2022).
27. Singh S, Jagadamma S, Yoder D, Yin X, Walker F. Cropping system management responses to Cornell and Alabama soil health assessment methods in the southeastern United States. Soil Sci Soc Am J (2022) 86(1):106–17. doi: 10.1002/saj2.20357
28. Chahal I, Van Eerd L. Evaluation of commercial soil health tests using a medium-term cover crop experiment in a humid, temperate climate. Plant Soil (2018) 427:1–17. doi: 10.1007/s11104-018-3653-2
29. Chahal I, Van Eerd LL. Quantifying soil quality in a horticultural-cover cropping system. Geoderma (2019) 352:38–48. doi: 10.1016/j.geoderma.2019.05.039
30. Chu M, Singh S, Walker FR, Eash NS, Buschermohle MJ, Duncan LA, et al. Soil health and soil fertility assessment by the haney soil health test in an agricultural soil in west Tennessee. Commun. Soil Sci Plant Anal (2019) 50:1–9. doi: 10.1080/00103624.2019.1604731
31. Singh S, Jagadamma S, Yoder D, Yin X, Walker F. Agroecosystem management responses to Haney soil health test in the southeastern United States. Soil Sci Soc Am J (2020) 84(5):1705–21. doi: 10.1002/saj2.20131
32. Mukherjee A, Lal R. Comparison of soil quality index using three methods. PloS One (2014) 9(8):e105981. doi: 10.1371/journal.pone.0105981
33. Congreves K, Hayes A, Verhallen E, Van Eerd L. Long-term impact of tillage and crop rotation on soil health at four temperate agroecosystems. Soil Tillage Res (2015) 152:17–28. doi: 10.1016/j.still.2015.03.012
34. Vasu D, Singh SK, Ray SK, Duraisami VP, Tiwary P, Chandran P, et al. Soil quality index (SQI) as a tool to evaluate crop productivity in semi-arid Deccan plateau, India. Geoderma (2016) 282:70–9. doi: 10.1016/j.geoderma.2016.07.010
35. Askari MS, Holden NM. Indices for quantitative evaluation of soil quality under grassland management. Geoderma (2014) 230:131–42. doi: 10.1016/j.geoderma.2014.04.019
36. Obade V, Lal R. A standardized soil quality index for diverse field conditions. Sci Total Environ (2016) 541:424–34. doi: 10.1016/j.scitotenv.2015.09.096
37. Nortcliff S. Standardisation of soil quality attributes. Agric Ecosyst Environ (2002) 88(2):161–8. doi: 10.1016/S0167-8809(01)00253-5
38. Maharjan B, Das S, Acharya BS. Soil Health Gap: A concept to establish a benchmark for soil health management. Global Ecol Conserv (2020) 23:e01116. doi: 10.1016/j.gecco.2020.e01116
39. Buol SW, Southard RJ, Graham RC, McDaniel PA. Soil genesis and classification. 6th ed. Ames, IA: Wiley-Blackwell (2011).
40. Mylavarapu R, Mitchell C, Savoy H. Soils of the Southeastern US. Soil test methods from the southeastern United States, 2. In: Soil test methods from the southeastern United States. Southern Cooperative Series Bulletin (2014). p. 419.
41. Yoder D, Jagadamma S, Singh S, Nouri A, Xu S, Saha D, et al. Soil health: meaning, measurement, and value through a critical zone lens. J Soil Water Conserv (2022) 77(1):88–99. doi: 10.2489/jswc.2022.00042
42. Duiker SW. Diagnosing soil compaction using a penetrometer (soil compaction tester). Agron (2002) 63(4).
43. Kemper W, Rosenau R. Aggregate stability and size distribution. In: Klute A, editor. Methods of soil analysis, Part 1: Physical and mineralogical methods. Wisconsin, USA: Soil Science Society of America: Madison (1986). p. 425–42.
44. Gee GW, Or D. 2.4 particle-size analysis. In: Methods of soil analysis. Part 4 Physical methods’." Soil Science Society of America Book Series 5 (2002). p. 255–93.
45. Reynolds S. The gravimetric method of soil moisture determination Part III An examination of factors influencing soil moisture variability. J Hydrol. (1970) 11(3):288–300. doi: 10.1016/0022-1694(70)90068-5
46. Grossman R, Reinsch T. The solid phase, bulk density and linear extensibility. In: Dane JH, Topp GC, editors. Methods of soil analysis.:Part 4. SSSA Book Ser.5. (Madison, WI: SSSA) (2002). p. 201–28.
47. Wright SF, Upadhyaya A. Extraction of an abundant and unusual protein from soil and comparison with hyphal protein of arbuscular mycorrhizal fungi. Soil Sci (1996) 161(9):575–86. doi: 10.1097/00010694-199609000-00003
48. Moebius-Clune B, Moebius-Clune D, Gugino B, Idowu O, Schindelbeck R, Ristow A, et al. Comprehensive assessment of soil health–The Cornell framework manual. Ithaca, NY: Cornell University (2016).
49. Zibilske L, Weaver R.W, Angle S, Bottomley P, Bezdicek D, Smith S, Tabatabai A, Wollum A (Eds.). Carbon mineralization. In: Methods of Soil Analysis, Part 2, Microbiological and Biochemical Properties. Soil Science Society of America Book Series, vol.5. Soil Science Society America Inc., Madison (1994). p. 835–64.
50. Weil RR, Islam KR, Stine MA, Gruver JB, Samson-Liebig SE. Estimating active carbon for soil quality assessment: a simplified method for laboratory and field use. Am J Altern Agric (2003) 18(1):3–17. doi: 10.1079/AJAA200228
51. Haney R, Haney E. Simple and rapid laboratory method for rewetting dry soil for inCubations. Commun Soil Sci Plant Anal (2010) 41(12):1493–501. doi: 10.1080/00103624.2010.482171
52. Brinton WF. Laboratory soil handling affects CO2 respiration, amino-N and water stable aggregate results. Agric Res Tech. J (2020) 24(2):53–62. doi: 10.19080/ARTOAJ.2020.22.556262
53. Jones D, Willett V. Experimental evaluation of methods to quantify dissolved organic nitrogen (DON) and dissolved organic carbon (DOC) in soil. Soil Biol Biochem (2006) 38(5):991–9. doi: 10.1016/j.soilbio.2005.08.012
54. Drinkwater LE, Cambardella CA, Reeder JD, Rice CW. Potentially mineralizable nitrogen as an indicator of biologically active soil nitrogen. In: Doran JW, Jones AJ, editors. Methods for assessing soil quality. Madison: Soil Science Society of America Inc. (1997). p. 217–29.
55. Brookes P, Landman A, Pruden G, Jenkinson D. Chloroform fumigation and the release of soil nitrogen: a rapid direct extraction method to measure microbial biomass nitrogen in soil. Soil Biol Biochem (1985) 17(6):837–42. doi: 10.1016/0038-0717(85)90144-0
56. Vance ED, Brookes PC, Jenkinson DS. An extraction method for measuring soil microbial biomass C. Soil Biol Biochem (1987) 19(6):703–7. doi: 10.1016/0038-0717(87)90052-6
57. German DP, Weintraub MN, Grandy AS, Lauber CL, Rinkes ZL, Allison SD. Optimization of hydrolytic and oxidative enzyme methods for ecosystem studies. Soil Biol Biochem (2011) 43(7):1387–97. doi: 10.1016/j.soilbio.2011.03.017
58. Diekow J, Mielniczuk J, Knicker H, Bayer C, Dick DP, Kögel-Knabner I. Carbon and nitrogen stocks in physical fractions of a subtropical Acrisol as influenced by long-term no-till cropping systems and N fertilisation. Plant Soil (2005) 268(1):319–28. doi: 10.1007/s11104-004-0330-4
59. Mehlich A. Determination of P, Ca, Mg, K, Na and NH4 by North Carolina soil testing laboratories. Raleigh: University of North Carolina (1953).
60. Mulvaney R. Nitrogen—inorganic forms. Nitrogen—Inorganic forms. (1996). (Cornell University: NY). 1123–84.
61. Youker R, McGuinness J. A short method of obtaining mean weight-diameter values of aggregate analyses of soils. Soil Sci (1957) 83(4):291–4. doi: 10.1097/00010694-195704000-00004
62. Singh S, Nouri A, Singh S, Anapalli S, Lee J, Arelli P, et al. Soil organic carbon and aggregation in response to thirty-nine years of tillage management in the southeastern US. Soil Tillage Res (2020) 197:104523. doi: 10.1016/j.still.2019.104523
64. Andrews S, Karlen D, Mitchell J. A comparison of soil quality indexing methods for vegetable production systems in Northern California. Agric Ecosyst Environ (2002) 90(1):25–45. doi: 10.1016/S0167-8809(01)00174-8
66. Rezaei SA, Gilkes RJ, Andrews SS. A minimum data set for assessing soil quality in rangelands. Geoderma (2006) 136(1):229–34. doi: 10.1016/j.geoderma.2006.03.021
67. Li P, Zhang T, Wang X, Yu D. Development of biological soil quality indicator system for subtropical China. Soil Tillage Res (2013) 126:112–8. doi: 10.1016/j.still.2012.07.011
68. Ray S.K, Bhattacharyya T, Reddy K.R, Pal D.K, Chandran P, Tiwary P, et al. Soil and land quality indicators of the Indo-Gangetic Plains of India. Curr Sci (2014), 107, 1470–86. Available at: https://www.jstor.org/stable/24107210.
69. Doran JW, Parkin TB. Defining and assessing soil quality. In: Doran JW, Coleman ,DC, Bezdicek DF, Stewart BA, editors. Defining soil quality for a sustainable environment. Madison, WI, USA: Soil Science Society of America, Inc. (1994). p. 3–21. p. 35.
70. Christensen BT. Physical fractionation of soil and structural and functional complexity in organic matter turnover. Eur J Soil Sci (2001) 52(3):345–53. doi: 10.1046/j.1365-2389.2001.00417.x
71. Gregorich E, Beare M, McKim U, Skjemstad J. Chemical and biological characteristics of physically uncomplexed organic matter. Soil Sci Soc Am J (2006) 70(3):975–85. doi: 10.2136/sssaj2005.0116
72. Tan Z, Lal R, Owens L, Izaurralde R. Distribution of light and heavy fractions of soil organic carbon as related to land use and tillage practice. Soil Tillage Res (2007) 92(1-2):53–9. doi: 10.1016/j.still.2006.01.003
73. Mirsky SB, Lanyon LE, Needelman BA. Evaluating soil management using particulate and chemically labile soil organic matter fractions. Soil Sci Soc Am J (2008) 72(1):180–5. doi: 10.2136/sssaj2005.0279
74. Jagadamma S, Lal R. Distribution of organic carbon in physical fractions of soils as affected by agricultural management. Biol Fertil. Soils (2010) 46(6):543–54. doi: 10.1007/s00374-010-0459-7
75. Schindelbeck R, Moebius-Clune B, Kurtz K, van Es H, Gugino B, Idowu O, et al. Cornell University comprehensive assessment of soil health laboratory standard operating procedures. Ithaca: Cornell Univ. (2016).
76. Fine AK, van Es HM, Schindelbeck RR. Statistics, scoring functions, and regional analysis of a comprehensive soil health database. Soil Sci Soc Am J (2017) 81(3):589–601. doi: 10.2136/sssaj2016.09.0286
77. Franzluebbers AJ, Veum KS. Comparison of two alkali trap methods for measuring the flush of CO2. Agron J (2020) 112(2):1279–86. doi: 10.1002/agj2.20141
78. Six J, Elliott E, Paustian K. Aggregate and soil organic matter dynamics under conventional and no-tillage systems. Soil Sci Soc Am J (1999) 63(5):1350–8. doi: 10.2136/sssaj1999.6351350x
79. Six J, Elliott E, Paustian K. Soil macroaggregate turnover and microaggregate formation: a mechanism for C sequestration under no-tillage agriculture. Soil Biol Biochem (2000) 32(14):2099–103. doi: 10.1016/S0038-0717(00)00179-6
80. Al-Kaisi MM, Yin X, Licht MA. Soil carbon and nitrogen changes as influenced by tillage and cropping systems in some Iowa soils. Agric Ecosyst Environ (2005) 105(4):635–47. doi: 10.1016/j.agee.2004.08.002
81. Motta AC, Wayne Reeves D, Burmester C, Feng Y. Conservation tillage, rotations, and cover crop affecting soil quality in the Tennessee valley: Particulate organic matter, organic matter, and microbial biomass. Commun Soil Sci Plant Anal (2007) 38(19-20):2831–47. doi: 10.1080/00103620701663065
82. Nouri A, Lee J, Yin X, D Tyler D, Jagadamma S, Arelli P. Soil physical properties and soybean yield as influenced by long-term tillage systems and cover cropping in the midsouth USA. Sustainability (2018) 10(12):4696. doi: 10.3390/su10124696
83. Nouri A, Lee J, Yin X, Tyler DD, Saxton AM. Thirty-four years of no-tillage and cover crops improve soil quality and increase cotton yield in Alfisols, Southeastern USA. Geoderma (2019) 337:998–1008. doi: 10.1016/j.geoderma.2018.10.016
84. Mbuthia LW, Acosta-Martínez V, DeBruyn J, Schaeffer S, Tyler D, Odoi E, et al. Long term tillage, cover crop, and fertilization effects on microbial community structure, activity: Implications for soil quality. Soil Biol Biochem (2015) 89:24–34. doi: 10.1016/j.soilbio.2015.06.016
85. Williams H, Colombi T, Keller T. The influence of soil management on soil health: An on-farm study in southern Sweden. Geoderma (2020) 360:114010. doi: 10.1016/j.geoderma.2019.114010
86. Kuo S, Sainju U, Jellum E. Winter cover crop effects on soil organic carbon and carbohydrate in soil. Soil Sci Soc Am J (1997) 61(1):145–52. doi: 10.2136/sssaj1997.03615995006100010022x
87. Sainju U, Whitehead W, Singh B. Cover crops and nitrogen fertilization effects on soil aggregation and carbon and nitrogen pools. Can J Soil Sci (2003) 83(2):155–65. doi: 10.4141/S02-056
88. Blanco-Canqui H, Shaver TM, Lindquist JL, Shapiro CA, Elmore RW, Francis CA, et al. Cover crops and ecosystem services: Insights from studies in temperate soils. Agron J (2015) 107(6):2449–74. doi: 10.2134/agronj15.0086
89. Steenwerth K, Belina K. Cover crops and cultivation: Impacts on soil N dynamics and microbiological function in a Mediterranean vineyard agroecosystem. Appl Soil Ecol (2008) 40(2):370–80. doi: 10.1016/j.apsoil.2008.06.004
90. Babujia L, Hungria M, Franchini J, Brookes P. Microbial biomass and activity at various soil depths in a Brazilian oxisol after two decades of no-tillage and conventional tillage. Soil Biol Biochem (2010) 42(12):2174–81. doi: 10.1016/j.soilbio.2010.08.013
91. Blanco-Canqui H, Mikha MM, Presley DR, Claassen MM. Addition of cover crops enhances no-till potential for improving soil physical properties. Soil Sci Soc Am J (2011) 75(4):1471–82. doi: 10.2136/sssaj2010.0430
92. Sapkota TB, Mazzoncini M, Bàrberi P, Antichi D, Silvestri N. Fifteen years of no till increase soil organic matter, microbial biomass and arthropod diversity in cover crop-based arable cropping systems. Agron Sustain Dev (2012) 32(4):853–63. doi: 10.1007/s13593-011-0079-0
93. Poeplau C, Don A. Carbon sequestration in agricultural soils via cultivation of cover crops–A meta-analysis. Agric Ecosyst Environ (2015) 200:33–41. doi: 10.1016/j.agee.2014.10.024
94. Bastida F, Zsolnay A, Hernández T, García C. Past, present and future of soil quality indices: a biological perspective. Geoderma (2008) 147(3-4):159–71. doi: 10.1016/j.geoderma.2008.08.007
95. Sinha S, Masto R, Ram L, Selvi V, Srivastava N, Tripathi R, et al. Rhizosphere soil microbial index of tree species in a coal mining ecosystem. Soil Biol Biochem (2009) 41(9):1824–32. doi: 10.1016/j.soilbio.2008.11.022
96. Zhang C, Liu G, Xue S, Song Z. Rhizosphere soil microbial activity under different vegetation types on the Loess Plateau, China. Geoderma (2011) 161(3-4):115–25. doi: 10.1016/j.geoderma.2010.12.003
97. Zornoza R, Acosta J, Bastida F, Domínguez S, Toledo D, Faz A. Identification of sensitive indicators to assess the interrelationship between soil quality, management practices and human health. Soil (2015) 1(1):173–85. doi: 10.5194/soil-1-173-2015
Keywords: weighted soil health index, soil health gap, soil health indicators, comprehensive assessment of soil health, cover crops, continuous cotton, corn-soybean
Citation: Singh S, Jagadamma S, Yoder D, Yin X and Walker F (2023) A weighted soil heath index approach for refined assessment of soil health in cropping systems. Front. Soil Sci. 3:1118526. doi: 10.3389/fsoil.2023.1118526
Received: 07 December 2022; Accepted: 20 July 2023;
Published: 11 August 2023.
Edited by:
Leila Esmaeelnejad, Soil & Water Research Institute, IranReviewed by:
Erin Silva, University of Wisconsin-Madison, United StatesKevin Hiscock, University of East Anglia, United Kingdom
Copyright © 2023 Singh, Jagadamma, Yoder, Yin and Walker. This is an open-access article distributed under the terms of the Creative Commons Attribution License (CC BY). The use, distribution or reproduction in other forums is permitted, provided the original author(s) and the copyright owner(s) are credited and that the original publication in this journal is cited, in accordance with accepted academic practice. No use, distribution or reproduction is permitted which does not comply with these terms.
*Correspondence: Sindhu Jagadamma, sjagada1@utk.edu