The Plenus Cold Event Record in the Abyssal DSDP Site 367 (Cape Verde, Central Atlantic): Environmental Perturbations and Impacts on the Nitrogen Cycle
 Laurent Riquier1*
  Pierre Cadeau2,3
  Julien Danzelle1
  François Baudin1 Emmanuelle Pucéat2
  Christophe Thomazo2,4
- 1UMR CNRS 7193 Institut des Sciences de la Terre de Paris (ISTeP), Sorbonne Université, Paris, France
- 2UMR 6282 Biogéosciences, Université de Bourgogne-Franche Comté, Dijon, France
- 3UMR 7154 Institut de physique du globe de Paris, Université de Paris, Paris, France
- 4Institut Universitaire de France, Paris, France
The Oceanic Anoxic Event 2, at the Cenomanian-Turonian boundary (∼93.9 Ma), was an episode of widespread burial of organic matter in marine sediments, underlined by a positive carbon-isotope (δ13C) excursion observed worldwide. Within this episode of O2-depleted conditions, a short interval of cooling, termed as the Plenus Cold Event, has been recorded in many sites and sections in the northern hemisphere (Tethyan domain, Western Interior Seaway, proto-North Atlantic Ocean). But, its record and its impact on the biogeochemical cycles of carbon and nitrogen in the southern part of Central Atlantic Ocean has not been explored yet. Here, we present a detailed geochemical study of the Deep Sea Drilling Project site 367 (Cape Verde) based on a compilation of previous and new data of carbon and nitrogen isotope signals as well as trace element concentrations. The aim of this study is to better constrain the evolution of oxygenation in the water column and the associated changes in nitrogen cycle before and during the Oceanic Anoxic Event 2 in order to understand the paleoceanographic and environmental consequences of the Plenus Cold Event at one of the deepest site of the Central Atlantic Ocean. Our new dataset improves the resolution of the δ13C curve for this site, and we propose a new chemo-stratigraphic frame of the carbon excursion allowing for a better identification of the short-term negative carbon isotope excursion associated to the Plenus Cold Event. The detailed evolution of redox-sensitive proxies (Mo, U, V, Fe, Cu, Ni enrichments and Corg/Ptotal) and isotopic signals (δ13Corg and δ15Ntotal) evidence that this deep site was impacted by this cooling event. While anoxic conditions prevailed in bottom waters before and during the onset of the Oceanic Anoxic Event 2 characterized by euxinic NH4+-rich water column, this cooling event was accompanied by reoxygenation of the water column, which had affected the behavior of the redox-sensitive elements and caused changes in nitrogen biogeochemical cycling.
Introduction
The Cenomanian-Turonian boundary (CTB, ∼93.9 Ma ago) is marked by a major environmental disturbance namely the Oceanic Anoxic Event 2 (OAE-2; Schlanger and Jenkyns, 1976). Among the numerous deoxygenation events developed in oceanic domains during the Jurassic and Cretaceous (Jenkyns, 2010 and references herein), OAE-2 has been extensively studied during the last decades because it is one of the most intense and most widespread event, and because of its particularly well preservation in the sedimentary record.
The geological evidence of this event lies primarily on the occurrence of black laminated organic-rich sediments (e.g., black shale) across a wide range of marine settings, ranging from deep ocean basins to shallow shelfal seas. The widespread deposition of these black shales is associated to a short-term (<1 Myr) perturbation of the carbon cycle marked in the case of OAE-2 by a positive carbon-isotope excursion (CIE) recorded in both the organic (δ13Corg, up to 6.0‰) and inorganic (δ13Ccarb, up to 2.5‰) reservoirs (e.g., Scholle and Arthur, 1980; Schlanger et al., 1987; Arthur et al., 1988; Jenkyns et al., 1994; Kuypers et al., 2002; Tsikos et al., 2004; Bowman and Bralower, 2005; Erbacher et al., 2005; Sageman et al., 2006; Jarvis et al., 2011; Gale et al., 2019; Danzelle et al., 2020). The positive CIE, resulting from preferential burial of 12C-rich organic carbon in marine sediments and observed in many marine DSDP-ODP-IODP sites and continental sections and cores, is used to define the extent of the biogeochemical OAE-2 (Gale et al., 1993; Kuypers et al., 2002).
This increased sedimentary organic matter (OM) burial rate is usually argued to reflect increasing nutrient delivery at basin scales leading to increasing primary productivity subsequently transferred to the sedimentary record by deposition of organic-rich deposits. Among possible drivers responsible for this increase in nutrient inputs, an accelerated hydrological cycle is frequently suggested as the leading hypothesis (Arthur et al., 1988; Jenkyns et al., 1994; Kuypers et al., 1999; Jarvis et al., 2011; van Helmond et al., 2014b). This intensification of the hydrological cycle, favoring continental weathering, is due to greenhouse conditions including high temperatures, high atmospheric pCO2, and increases in humidity, as observed at the onset of the OAE-2 (Jarvis et al., 2011). This greenhouse paleoclimate has been directly related to intense volcanic activities associated to emplacement of submarine large igneous provinces (Caribbean and High-Artic) releasing vast quantities of CO2 into the ocean and atmosphere (Sinton and Duncan, 1997; Jones and Jenkyns, 2001; Snow et al., 2005; van Bentum et al., 2012; Jenkyns et al., 2017). Seafloor hydrothermalism, associated with these large igneous provinces, and subaerial volcanism may also have supplied nutrients such as metals into seawater reservoirs, sustaining higher primary productivity (Orth et al., 1993; Kuroda et al., 2007; Turgeon and Creaser, 2008; Zheng et al., 2013; Du Vivier et al., 2015; Holmden et al., 2016). As a direct consequence of vigorous and sustained primary productivity, a profound deoxygenation of the water column in many parts of the world ocean, but particularly well expressed in the proto-North Atlantic and in the Central Atlantic (e.g., Sinninghe Damsté and Köster, 1998; Pearce et al., 2009; Jenkyns, 2010; van Helmond et al., 2014a; Westermann et al., 2014), is recorded in several biogeochemical cycling of elements including but not limited to nitrogen, sulfur, iron and trace metals such as molybdenum or uranium (Brumsack, 2006; Junium and Arthur, 2007; Owens et al., 2012, 2013; Ruvalcaba Baroni et al., 2015). Bottom water anoxia possibly affected up to 50% of the global ocean with local occurrences of euxinic conditions (Monteiro et al., 2012; Owens et al., 2013; Ostrander et al., 2017).
The positive CIE, associated with the OAE-2, is however interrupted by a short-term negative anomaly registered in many sites and sections and referred to as the Plenus carbon isotope excursion (P-CIE; O’Connor et al., 2020). The global distribution of this isotopic carbon anomaly argues for a global change of the carbon cycle. Based on pCO2-dependent proxies (Δ13C; stomatal index, leaf-wax δ13C), the P-CIE has been interpreted as a short episode of pCO2 rise during the δ13C fall, followed by a decrease in pCO2 up to the δ13C maximum value (Kuypers et al., 1999; Sinninghe Damsté et al., 2008; Barclay et al., 2010; Sinninghe Damsté et al., 2010; Jarvis et al., 2011; Danzelle et al., 2020). These rapid oscillations of CO2 concentration are thought to be linked to changes in temperature and oxygenation in oceanic domain. Geochemical evidences of oscillations in the oxygenation state of the water column include decrease in OM content and changes in the concentrations of redox–sensitive trace elements (RSTE: Mo, U, V, Cu) recorded within the P-CIE (Jarvis et al., 2011; van Helmond et al., 2014a; Clarkson et al., 2018; Danzelle et al., 2018, 2020; Gale et al., 2019). The reoxygenation interval is usually termed the benthic oxic zone and marked by repopulation of benthic fauna (Friedrich et al., 2006; Keller et al., 2008; Eldrett et al., 2014). The climatic perturbation is associated to the Plenus Cold Event (PCE; Gale and Christensen, 1996). This event, initially highlighted by the incursion of boreal marine fauna into the mid-latitudinal basins (Vocontian Basin, SE France; Jefferies, 1962, Jefferies, 1963), is now well defined in several basins and at all latitudes (see review of O’Connor et al., 2020 and references herein). The PCE is coeval to the second buildup of the δ13C signal within the positive CIE and has been geochemically characterized by positive isotopic excursion of the δ18O signal and by a decrease of dedicated biomarkers concentrations, such as the crenarchaeotal membrane lipid, linked to the TEX86, a sea-surface temperature proxy (Jenkyns et al., 1994; Paul et al., 1999; Tsikos et al., 2004; Forster et al., 2007; Sinninghe Damsté et al., 2008; Takashima et al., 2009; Danzelle et al., 2020). The origin of this short-term carbon cycle event is still debated (atmospheric vs. oceanographic; regional vs global processes) because the triggering factors of CO2 change are difficult to identify. The rise in pCO2 is thought to be linked to the incursion of a cold oxygenated water mass in tropical to equatorial zones, associated to modification of oceanic circulation (Jenkyns et al., 2017). This oceanographic change would led to the remineralization of buried OM, which may cause trace metals released from the sediments into the water column and acidification. The PCE has been largely argued to reflect a drawdown in atmospheric pCO2 of about 20–25% (Freeman and Hayes, 1992; Jarvis et al., 2011) with extreme estimate up to 40–80% (Kuypers et al., 1999), resulting from a negative feedback caused by the combination of increased organic carbon burial, CO2 consumption due to enhanced silicate weathering (Arthur et al., 1988; Sinninghe Damsté et al., 2010; Blättler et al., 2011; Jarvis et al., 2011; Pogge von Strandmann et al., 2013; Jenkyns et al., 2017) and potential cessation of volcanic outgassing (Kuroda et al., 2007).
While a causal relationship between carbon-cycle dynamics and cooling during the PCE is therefore largely documented and argued, especially in mid-latitude zones, little is known on the related biogeochemical cycle of nitrogen at this level of temporal resolution. Meanwhile, previous studies on the nitrogen isotopes record of OM during OAE-2 have proposed several hypotheses to explain commonly observed decrease in sedimentary δ15Ntotal values such as depth variations of water column chemocline, hence activity and locus of nitrogen fixers and denitrifiers guilds (Kuypers et al., 2002; Junium and Arthur, 2007; Higgins et al., 2012) or changes in the pathway of diazotrophy (from canonical Mo-nitrogenase to alternative V-Fe or Fe-only nitrogenases; Zhang et al., 2014). According to the short residence time of fixed N in modern seawater (<3 kyr) (Tyrrell, 1999; Brandes and Devol, 2002) and to the estimated duration of the P-CIE ca. ∼105 kyr (Charbonnier et al., 2018) comprising the ∼40–60 kyr PCE as estimated for the boreal sites (Jarvis et al., 2011), high-resolution δ15Ntotal record of the OAE-2 may offer a chance to better characterized the impact of rapid swings in temperatures on the nitrogen biogeochemical cycle. Moreover, within the context of the greenhouse OAE-2, the short lived PCE provides a unique opportunity to testify the hypothesis of Algeo et al. (2014), who proposed that the link between high temperatures and low δ15Ntotal values observed on long times scale during greenhouse intervals may be potentially also observed during shorter event such as OAEs and should reflect lower integrated water-column denitrification rates in comparison to icehouse intervals.
Among the several sites, where the OAE-2 and the PCE has been recorded, the Deep Sea Drilling Project (DSDP) site 367 (Leg 41, Cape Verde, Central Atlantic) represents an interesting study case, characterized by a positive CIE of 6.0‰ (Arthur et al., 1988) and by a noticeable enrichment of organic carbon (up to 45%; after Herbin et al., 1986) deposited in abyssal environment in low latitude zone. Previous studies, mainly based on δ13C and δ15Ntotal isotopic signatures and biomarker identifications (Kuypers et al., 2002, Kuypers et al., 2004; Sinninghe Damsté et al., 2008), organic paleothermometer TEX86 (Schouten et al., 2003; Forster et al., 2007), iron speciation, δ56FeT, δ98/95Mo isotopic signatures (Owens et al., 2012; Westermann et al., 2014; Dickson et al., 2016) and some trace element concentrations (Kuypers et al., 2002; Westermann et al., 2014) have been already realized on a few samples (14–17, except for Dickson et al. (2016), which was realized on 114 samples from the archive of half of the core) of this deep-water site. An integrated and detailed work is however needed to better constrain the primary signal of geochemical proxies, to reconstruct the paleo-environmental conditions during the OAE-2 and the PCE and to determine the impact of this event on the nitrogen cycle in one of the deepest settings of the CTB.
The aim of this work is thus to 1) achieve a detailed study of the OAE-2 in deep-sea context based on a multi-proxy study (including δ13Corg, δ15Ntotal, Rock-Eval and trace metals) of the DSDP 367 succession from Cape Verde, and 2) propose a model that account for the evolution of the biogeochemical cycle of nitrogen and its relation to environmental perturbations for the southeastern part of the Central Atlantic.
Material and Methods
Sampling Location
Site 367 (12°29.2′N; 20°02.8′W) was drilled in 1975 during the DSDP Leg 41 and is located off the coast of the Senegal in the Cape Verde Basin (Figure 1). This site shows an almost continuous sedimentary record from Upper Jurassic (Oxfordian-Kimmeridgian) up to Pleistocene (Lancelot et al., 1978). During the Cretaceous, this site belonged to the southern part of the Central Atlantic and a paleodepth of around 3,700 m has been estimated based on isostatic methods (Chenet and Francheteau, 1979). Thus, sediments were deposited in abyssal plain environment, probably below the Carbonate Compensation Depth (even if some traces of carbonate do exist, Chenet and Francheteau, 1979).
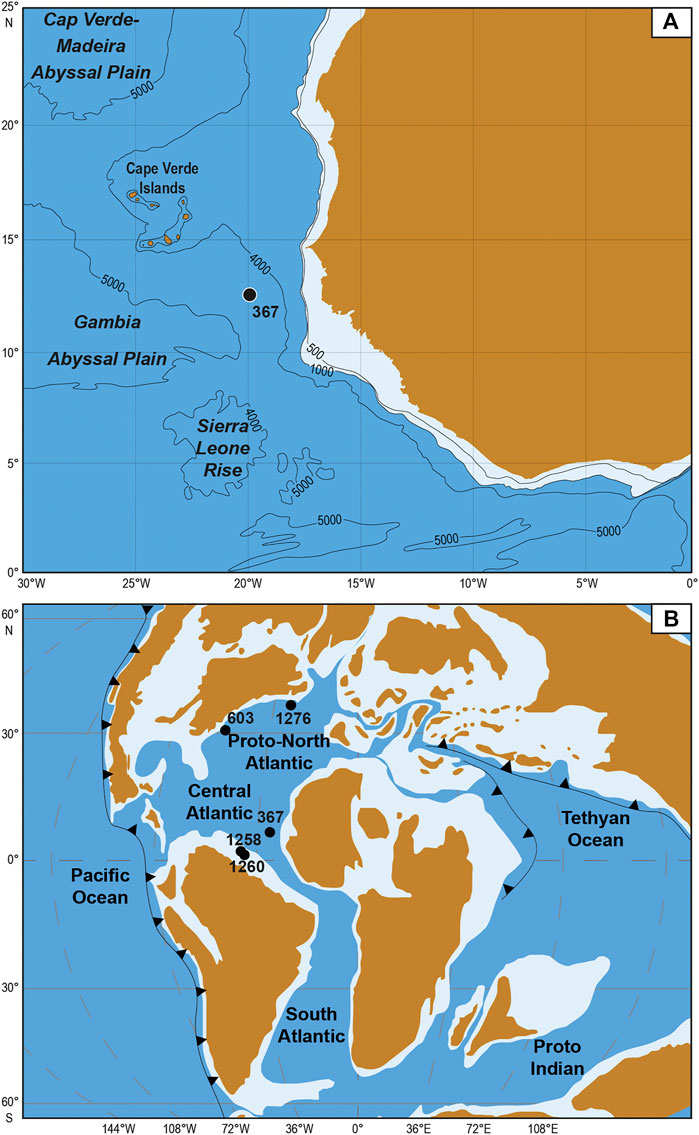
FIGURE 1. Location of the DSDP site 367 in the Cape Verde Basin (modified from Lancelot et al., 1978) (A) and paleomap of the Cenomanian-Turonian Central Atlantic and proto-North Atlantic zones with the paleopositions of the site 367 and other DSDP/ODP sites (603, 1258, 1260, and 1276) mentioned in this paper (van Hinte et al., 1993; Erbacher et al., 2004a, Erbacher et al., 2004b; Tucholke et al., 2004) (B).
The studied succession, composed of cores 19 and 18, is about 13.5 m thick (from 650 to 636.5 m depth), with a coring hiatus of 2.2 m from 645.7 to 643.5 m depth. The sedimentary sequence is mainly composed of laminated black shales and terrigenous silicates. In details, in core 19, green and olive-grey calcareous clays are interbeded with laminated black shales whereas the core 18 is dominantly composed of laminated black shales, especially in the sections 5 and 1 (Mélières, 1978; Herbin et al., 1986). In some studied samples, some strong post-depositional oxidation of the pyrite within the sediments has been noticed and is underlined by the presence of abundant jarosite and iron oxides.
Methods
A total of 42 rock samples were collected every 5–20 cm according to sample availability as following: seven from the base of the studied interval up to the void (650.5–647.7 m depth) and 35 above the void (643.3–636.5 m depth). After cleaning, all rock samples were powdered manually in an agate mortar, at the Biogeosciences Laboratory of the University of Burgundy in Dijon (France).
Carbon and Nitrogen Analyses
Concentration and isotopic composition of organic carbon (Corg, δ13Corg) and total nitrogen (Ntotal, δ15Ntotal) were measured on carbonate free residues. Sample powders were rinsed by dichloromethane-ethanol (9:1) to remove any modern organic contaminant and reacted with hydrochloric acid (HCl; 6N) at room temperature overnight followed by 4 h at 80°C to remove carbonate phases. The residues were rinsed with deionized distilled water and centrifuged several times until neutral pH was reached and then dried at 60°C overnight in an oven. Aliquots of carbonate free samples (30–60 mg) were then weighed and poured in tin capsules. Isotopic measurements were performed at the Biogeosciences Laboratory, Dijon (France), on a vario Micro cube elemental analyser (Elementar) coupled to an IsoPrime stable isotope ratio mass spectrometer (Isoprime) in continuous flow mode. The carbon and nitrogen isotopic compositions are both expressed in delta notation and reported as the per mil (‰) deviation relative to the Vienna Pee Dee Belemnite (VPDB) standard for carbon and to AIR standard for nitrogen. USGS40 certified reference material (C = 40.8 wt%; N = 9.52 wt%; δ13CVPDB = −26.39‰, δ15NAIR = −4.52‰) was used for calibration. The organic carbon (Corg) and total nitrogen (Ntotal) content is expressed as dry weight percentage (wt%) of the total fraction. From these values, the molar Corg/Ntotal ratio was calculated. The external reproducibility based on duplicates analyses of carbonate free samples was better than ±0.15 wt% (1σ) for carbon and ±0.10 wt% (1σ) for nitrogen. External reproducibility based on duplicate analyses of the samples was better than ±0.05‰ and ±0.5‰ for carbon and nitrogen, respectively.
Rock-Eval Pyrolysis
Organic matter parameters, including Total Organic Carbon (TOC) content, Hydrogen Index (HI), Oxygen Index (OI) and temperature of the maximum yield of hydrocarbon (Tmax) were obtained using 10–50 mg of bulk powder, on a Rock-Eval 6 Turbo at the ISTeP Laboratory of Sorbonne University in Paris (France), by sequential pyrolysis and oxidation treatment (Espitalié et al., 1985a; Espitalié et al., 1985b; Espitalié et al., 1986; Lafargue et al., 1998; Behar et al., 2001). Reproducibility was evaluated by replicates analyses of laboratory standards and was better than ±0.05 wt% (1σ) for TOC, ± 1.5°C (1σ) for Tmax, ± 10 mg HC/g TOC (1σ) for HI, and ±10 mg CO2/g TOC (1σ) for OI. The TOC (%) concentration, obtained by whole-rock analyses from the Rock-Eval method, is in agreement with this of Corg, determined on the carbonate-free fraction (r = 0.97) and show similar vertical distribution but with lower value compared to Corg (except for one sample).
Analysis of Major and Trace Elements
Major and trace elements analyses were performed using inductively coupled plasma mass spectrometry (ICP-MS) at the Activation Laboratory (Actlab) in Ancaster, Canada. Protocol information for the package 4Litho-Lithium Metaborate/Tetraborate Fusion ICP and ICP-MS can be found at www.actlabs.com. Reproducibility is better than 2% of the measured values (1σ) for major and trace elements.
To eliminate a possible detrital origin of selected elements (Ba, Co, Cr, Cu, Mo, Ni U, V, Zn Fe, Si, and P), the Al concentration was linearly correlated with each element and correlation coefficient r was calculated (Table 1). Aluminum is considered as an indicator of the aluminosilicate contribution to the sediments and is also a conservative element during secondary processes. Fort most of them (except for Si, Th, Zr and to a lesser extent Cr), no noticeable correlation or anti-correlation is observed, suggesting a non-detrital (i.e., authigenic) origin. In order to compare values obtained in this work with those of previous studies and from other Central and proto-North Atlantic sites, the concentration of major and trace elements were normalized to aluminum (El/Al) to correct for dilution effects by varying carbonate or OM contents. It is important to note here that although Al concentrations are always upper than 1%, fluctuating from 1.2 to 6.6%, they show a progressive decreasing trend from the base to the top of the studied interval (see Supplementary Material). So, for few samples, mainly located in the upper part of the studied sections (638.1; 638.7 and 640.35 m) and characterized by the lowest concentration of Al (<1.5%), normalization may lead to a slight exaggeration of El/Al values.

TABLE 1. Correlation factor r between Al and major and minor elements.
Lastly, the enrichment factor (EF) was also calculated following the formula: EF = (Element/Al)sample/(Element/Al)reference. This reference could be either the Post-Archean Average Shales (PAAS, Wedepohl, 1971) or the Upper Continental Crust (UCC, McLennan, 2001). For this work, the EFs were calculated using the UCC concentrations. As precised by Algeo and Tribovillard (2009), EF > 3 represents a detectable authigenic enrichment, whereas EF > 10 represents a substantial authigenic enrichment.
Results
In order to have the highest resolution for geochemical signals, the results obtained in this study (n = 42) have been compiled with those of previous studies (n = 17 from Kuypers et al., 2002, Kuypers et al., 2004 and from H-J., Brumsack, unpublished data, for selected major and trace elements (Fe, Mn, P, Ni, Cu, Co, and Zn) on the same 17 samples; n = 29 from Forster et al., 2007 and n = 14 from Westermann et al., 2014).
Stable Isotopes
The δ13Corg values of this study range from −28.5 to −21.2‰ (Figure 2) and are in agreement with the data reported by Kuypers et al. (2002) completed by Forster et al. (2007) for this site. After a phase of stability at the base of the section (649.6–642.0 m) with δ13Corg values of ∼ −27.8‰, an increasing trend of about +3.5‰ is observed up to 641.15 m, where δ13Corg value reaches up to −24.3‰. This first increase is followed by a 1.45 m thick interval marked by lower values down to −25.8‰ at 640.8 m and a second phase of δ13Corg increase with values up to −22.4‰ recorded at 639.7 m. A short plateau interrupts this second rapid increase with values close to -23.5‰ around 640.35 m. Upward (639.7–636.5 m), δ13Corg values remain high oscillating between −22.5 and −21.2‰.
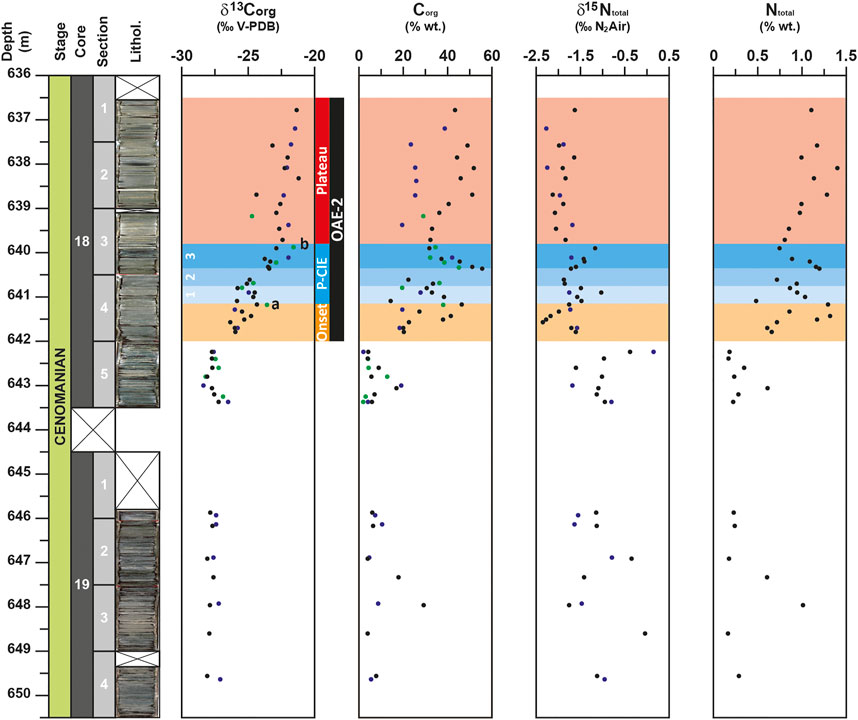
FIGURE 2. Depth-profiles for δ13Corg, δ15Ntotal signals, organic carbon (Corg) and total nitrogen (Ntotal) contents for the DSDP site 367. Data from the studies of Kuypers et al. (2002) and Kuypers et al. (2004) and Forster et al. (2007) are represented with blue and green circles respectively. OAE-2 interval is represented by the dark band determined on the base of the positive carbon isotope excursion. The OAE-2 interval is divided in three parts: the onset, represented by the orange band, the Plenus carbon isotope excursion (P-CIE), represented by the blue band and the plateau represented by the red band; a and b would correspond to the δ13Ccarb maxima, defined by Jarvis et al. (2011), that mark the limits between the onset and the P-CIE intervals and between the P-CIE and the plateau intervals. The P-CIE is sub-divided in three subparts numbered 1, 2, and 3 and represented by gradual darker blue bands.
The δ15Ntotal record of this study shows negative values ranging from −2.3 to −0.4‰, which also compare well to the δ15Ntotal record of Kuypers et al. (2004) for this site (Figure 2). Unlike the δ13Corg, the δ15Ntotal profile does not show interval of stable values at the base of the studied core. From 649.6 to 645.9 m and from 643.4 to 642.2 m, δ15Ntotal values oscillate between −1.7 and 0.0‰ and between −1.6 and −0.4‰, respectively. It is important to note here that maximum value of δ15Ntotal is reached at the base of the OAE-2, when δ13Corg values are yet low. The rest of the studied core is characterized by lower δ15Ntotal with values down to −1.5‰. However, unlike to the δ15Ntotal signal from Kuypers et al. (2004), which did not record noticeable variation from 642.0 to 636.5 m, two intervals can be recognized in the more detailed δ15Ntotal record of this study. During the first interval (641.8–639.9 m), δ15Ntotal values oscillate between −2.3 and −1.0‰, then from 639.7 to 636.5 m, a second interval of low δ15Ntotal values (∼−1.9‰) is recognized. In more details, the 1.9 m thick first interval (641.8–639.9 m) records a succession of two negative and two positive excursions of the δ15Ntotal. The first negative excursion of δ15Ntotal broadly corresponds to the first buildup of δ13Corg signal, the two positive excursions are recorded at the base and at the top of the 1.5 m thick interval marked by a slight trough and a second phase of rapid change in δ13Corg values, corresponding to the P-CIE.
Carbon, Nitrogen, and Phosphorus Contents
In the core 19, the Corg profile is marked by a noticeable peak up to 29.3% at 648.0 m (Figure 2). At the base of the core 18, a slight increase of Corg values up to 17% is observed around 643.0 m. Similar trend with Corg values up to 20% was previously recorded for this site by Kuypers et al. (2002) and Forster et al. (2007). This is followed by a short interval of low values (down to 4% at 642.25 m) and a progressive increase of Corg values up to 46.4% at 641.2 m. After an episode of oscillating values, a short interval with the highest Corg values (between 45.5 and 55.5%) is recorded from 640.35 to 640.2 m, followed by a rapid decrease down to 31.8% recorded at 639.9 m. Lastly, a progressive increasing trend followed by a second interval of high Corg values (between 43.4 and 51.8%) is recorded from 638.7 m up to the end of the studied section. This second increasing trend and associated high values of Corg were not observed in Kuypers et al. (2002) and Forster et al. (2007). In these studies, a plateau of values around 25% marked this interval. The Ntotal profile, which oscillates from 0.16 to 1.40%, shows a similar evolution than the Corg (r = 0.97) with high values (>0.8%) recorded at 648.0 m in the core 19 and from 641.5 m onward in the core 18 (Figure 2).
The Corg/Ntotal ratio shows high values when compared to the Redfield ratio (i.e. 106/16 = 6.625, Redfield, 1958) and range between 26 and 54 (Figure 3). This range of values is comparable to those (25–50) usually recorded in Cretaceous black shale deposits (Rau et al., 1987; Junium and Arthur, 2007). Moreover, similar to the δ13Corg, the Corg/Ntotal profile shows three distinguished intervals in the studied cores. From 649.60 to 642.25 m, all values are lower than 35, then upward a noticeable increase the Corg/Ntotal ratio is recorded with the highest value (54) reached at 640.35 m. From this depth onward, the Corg/Ntotal values remain high oscillating between 43 and 52.
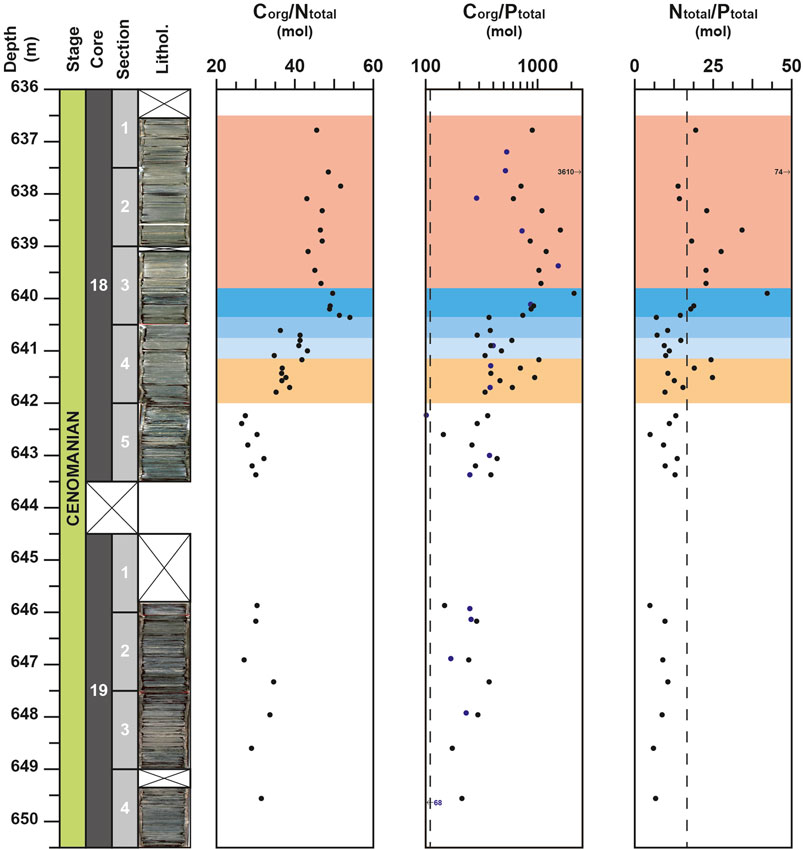
FIGURE 3. Depth-profiles for Corg/Ntotal, Corg/Ptotal and Ntotal/Ptotal molar ratios for the DSDP site 367. Data from the studies of Kuypers et al., 2002 and Kuypers et al., 2004) are represented with blue circles. Vertical dotted lines represent the Redfield ratio value (106 for Corg/Ptotal and 16 for Ntotal/Ptotal).
For the Corg/Ptotal molar ratio, all values are higher than the Redfield ratio (Corg/Ptotal = 106). In detail, the signal remains relatively constant from the base of the studied section up to 641.8 m with average value of 280. Then, an increasing trend is observed from 641.8 m up to 639.9 m, where the Corg/Ptotal molar ratio reaches 2093 (Figure 3). For the rest of the section, the Corg/Ptotal values tend to decrease but two noticeable peaks of 1,590 and 3,610 are recorded at 638.7 and 637.6 m, respectively.
The Ntotal/Ptotal molar ratio shows similar variations than the Corg/Ptotal molar ratio (r = 0.99). From 649.5 to 640.25 m, the Ntotal/Ptotal values are nearly constant with average values close to 10 (Figure 3). Only two peaks up to 24, due to increasing N content, are recorded at the base of the OAE-2 (at 641.5 and at 641.2 m). From 640.20 m onward, the Ntotal/Ptotal values sensibly increase, with most values exceeding the canonical Redfied ratio (i.e., Ntotal/Ptotal = 16).
Major and Trace Element Evolutions
Compared to the values of the UCC (McLennan, 2001), all the elements that are not linked to detrital fraction exhibit noticeable enrichment. The element to Al (El/Al) ratios exhibit contrasted evolutions depending on the considered element. For the core 19, most of elements record a positive peak of concentration and ratio at 648.0 m. This peak is particularly well expressed for U, V, Cd, Cu, and Zn (Figures 4,5) and corresponds to high Corg values (up to 29.3%).
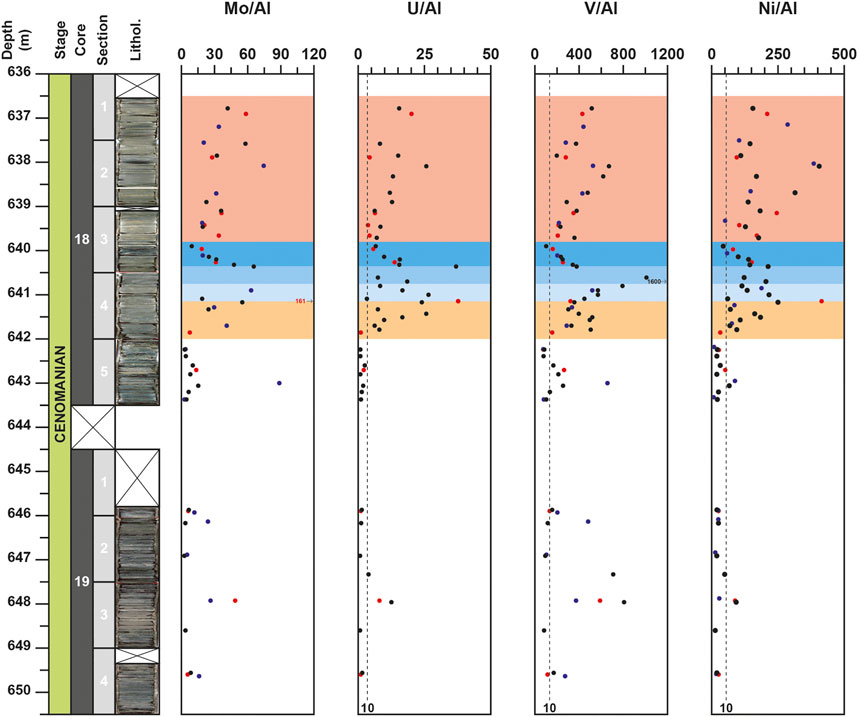
FIGURE 4. Depth-profiles for Mo/Al, U/Al, V/Al, Ni/Al for the DSDP site 367, Data from the studies of Kuypers et al. (2002), coupled to unpublished data from H-J. Brumsack on the same samples, and Westermann et al. (2014) are represented with blue and red circles respectively. Vertical black dotted line, noted 10, represent the El/Al values corresponding to an EF equal to 10, respectively compared to the Upper Continental Crust (McLennan, 2001): 0.19 for Mo/Al; 0.35 for U/Al; 13.31 for V/Al and 5.47 for Ni/Al.
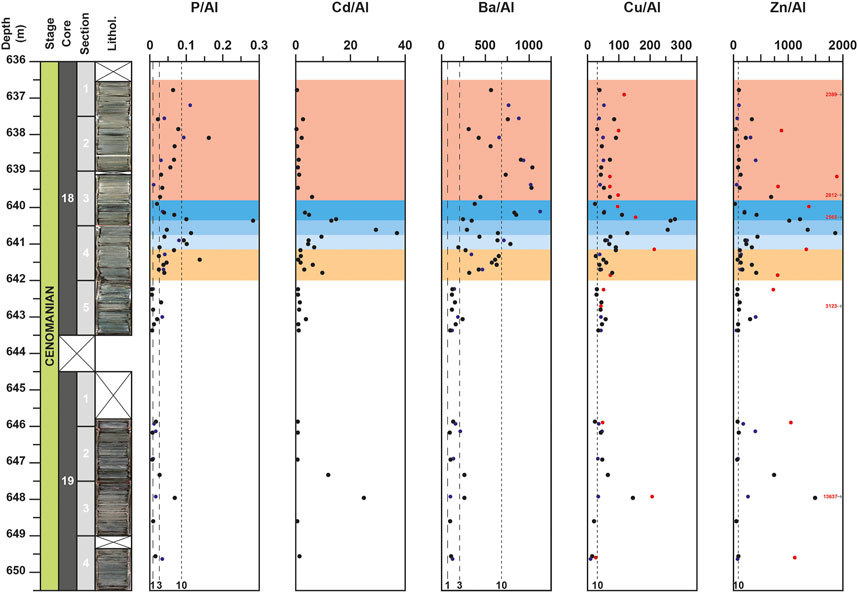
FIGURE 5. Depth-profiles for P/Al, Cd/Al, Ba/Al, Cu/Al, Zn/Al for the DSDP site 367. Data from the studies of Kuypers et al. (2002), coupled to unpublished data from H-J. Brumsack on the same samples, and Westermann et al. (2014) are represented with blue and red circles respectively. Vertical black dotted lines, noted 1, 3 and 10, represent the El/Al value corresponding to an EF equal to 1, 3 and 10, respectively compared to the Upper Continental Crust (McLennan, 2001): 0.087 for P/Al; 0.01 for Cd/Al; 68.41 for Ba/Al; 3.11 for Cu/Al and 8.83 for Zn/Al.
For the core 18, after a slight enrichment recorded around 643.0 m for only few elements (Mo, V, Ni, Zn, Ba), which was also observed in previous studies (Kuypers et al., 2002; Westermann et al., 2014), most elements are characterized by noticeable enrichments starting at 642.0 m and by an interval with the highest values from 640.8 to 640.35 m (Figures 4–6). This 45 cm-thick interval is well observed in the Al-normalized profiles of P, Cu, Zn, V, U, and Cd and corresponds to the highest values of Corg (up to 55.5%). Compared to previous studies (Kuypers et al., 2002; Westermann et al., 2014), the results obtained here allow to highlight for the first time this noticeable enrichment of these elements around 640.5 m depth. For most of them (P, Cu, Zn, V, U and Mo), this is followed by a noticeable decrease of El/Al values up to around 639.0 m depth. For few other elements, such as Ba, Ni, Co, and Fe, the highest values are observed upper in the core. For Ba, noticeable fluctuations are recorded from 642.0 m and the highest value are recorded around 639.0 m, whereas for Ni and Fe, the highest values are observed at 638.1 m and are coeval with peaks in the Al-normalized profiles of P, U, and V (Figures 4–6). Lastly, some elements, like Mn or Zr, do not show noticeable variations in the studied interval. These elements exhibit values mainly lower than the UCC value or close to it. Only one obvious positive peak at 640.9 m for Mn and a negative peak at 640.35 m for Zr are observed (Figure 6).
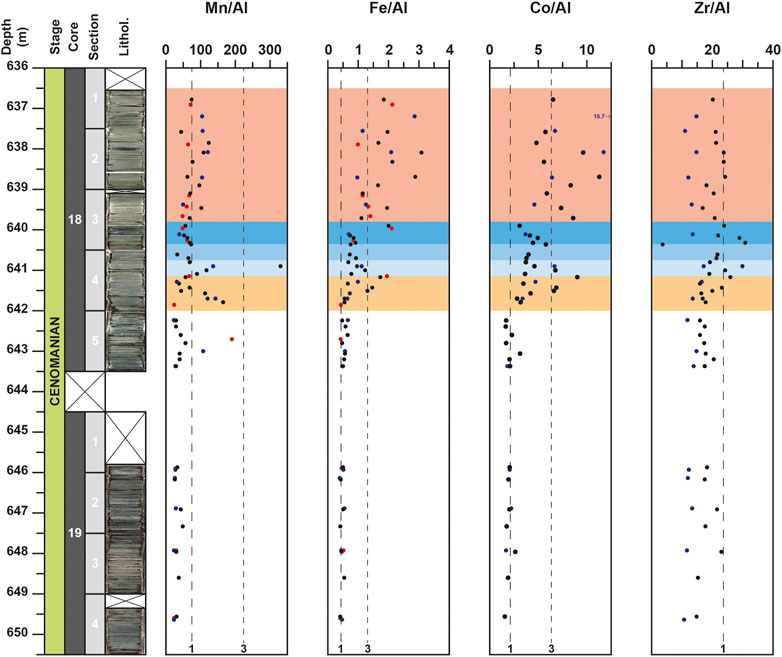
FIGURE 6. Depth-profiles for Mn/Al, Fe/Al, Co/Al and Zr/Al for the DSDP site 367. Data from the studies of Kuypers et al. (2002), coupled to unpublished data from H-J. Brumsack on the same samples, and Westermann et al. (2014) are represented with blue and red circles respectively. Vertical black dotted lines, noted 1 and 3, represent the El/Al value corresponding to an EF equal to 1 and 3, respectively compared to the Upper Continental Crust (McLennan, 2001): 0.75 for Mn/Al; 0.44 for Fe/Al; 2.11 for Co/Al and 23.63 for Zr/Al.
Interpretations and Discussions
Identification of the Plenus Carbon Isotope Excursion Within the Deep Sea Drilling Project Site 367
Since the works of Gale et al. (1993), it is well established that the OAE-2 is defined by a positive stable CIE, composed of several spikes and nudges. This excursion is usually subdivided into three main phases: an earlier phase A, named rapid shift, characterized by an increase in 13C/12C ratio values from the pre-excursion background value and thus by an increase of δ13C in both organic and carbonate fractions, a following phase B, corresponding to a plateau of high δ13C values, and a final phase C, characterized by a gradual drop of δ13C values toward pre-excursions level (Kuypers et al., 2002). As an OAE correspond by definition to the main phase of enhanced isotopically light organic carbon burial (Arthur et al., 1988), the Cenomanian-Turonian OAE-2 is thus restricted to the phases A and B (Kuypers et al., 2002). In high-resolution isotope profiles, such as measured in Eastbourne (Paul et al., 1999); Lambruisse (Takashima et al., 2009; Danzelle et al., 2020) and Pont d’Issole (Jarvis et al., 2011), the phase A can be further subdivided in three intervals: an initial rise in δ13Ccarb value, corresponding to the first buildup, ended by a first maximum value (δ13Ccarb maxima a in Jarvis et al., 2011), followed by a slight decrease, associated to a trough interval, and a further rise, corresponding to the second buildup, to the maximum values of the CIE (δ13Ccarb maxima b in Jarvis et al., 2011) that define the beginning of the phase B (plateau interval). The short-lived interval, composed by a “trough interval” and the “second build-up”, correspond to the P-CIE (O’Connor et al., 2020). This interval is associated with a cooling event, marked by a southerly incursion of boreal fauna (including the belemnite Praeactinocamax plenus, the bivalve Oxytoma seminudum and the serpulid worm Hamulus sp.) into mid-latitude areas (Jefferies, 1962; Gale and Christensen, 1996) and by positive oxygen isotopic excursion recorded in carbonates (Jarvis et al., 2011). This faunal and paleoclimatic event is referred to as the PCE (Gale and Christensen, 1996) and was identified from a number of paleo-temperature proxies at several European, North America and Atlantic sites. For the DSDP site 367, the PCE has been identified using the organic paleothermometer TEX86 signal which show low value (0.84) around 640.1 m (Schouten et al., 2003; Forster et al., 2007). In more details, the TEX86 signal records a ∼1 m thick interval (640.35–639.40 m) marked by a negative excursion, interpreted as a sea surface temperature decline of about 4°C (Forster et al., 2007). Recently, based on low δ98/95Mo values, Dickson et al. (2016) have reported in the same succession an 80 cm thick interval (640.86–640.05 m), slightly deeper to those defined by TEX86 signal corresponding to the PCE.
In agreement with previously OAE-2 carbon-isotope records (e.g., Paul et al., 1999), five distinctive phases can be recognized in the carbon-isotope signal of the DSDP site 367. The first phase of the δ13Corg signal (649.5–642.0 m), with values clustering around −27.8‰, corresponds to the pre-excursion interval. The first rapid shift of δ13Corg values up to −24.3‰ (642.00–641.15 m) corresponds to the first buildup, which marks the onset of the OAE-2, such as in typical CTB sections, like Eastbourne (Gale et al., 1993) and Pont d’Issole (Jarvis et al., 2011; Danzelle et al., 2018). The following 1.35 m thick interval (641.15–639.80 m) is interpreted as an equivalent of the P-CIE recorded in the Eastbourne section (O’Connor et al., 2020). The first 40 cm of this interval would represent the short trough and is referred here as the PCE-1 (641.15–640.75 m) and the last 95 cm would correspond to the second buildup. In this study, this interval is subdivided in two parts: a 40 cm thick interval referred here as the PCE-2 (640.75–640.35 m) and a 55 cm thick interval referred here as the PCE-3 (640.35–639.80 m). The limit between PCE-2 and PCE-3 corresponds to a short plateau of δ13C values. The top of the core encompasses part of the isotopic plateau, corresponding to the phase B in Kuypers et al. (2002) and start at 639.80 m. The end of the phase B and the gradual return to pre-excursion values, which marks the CTB and corresponds to the phase C are not recorded in the DSDP site 367.
Based on the new δ13C data, obtained in this study, the onset of the OAE-2 and the phase A should be moved from 643.0 m, as initially proposed by Kuypers et al. (1999), to 642.0 m depth. Even if the lowest values of δ13C signal, −28.4‰ in Kuypers et al. (1999) and −28.1‰ in this study are respectively recorded at 643.0 and 642.8 m, the following values do not show noticeable increase before 642 m. They oscillate from −27.6 to −27.2‰ in Kuypers et al. (1999) and Forster et al. (2007) and are close to −27.7‰ in this study. The onset of the δ13Corg shift is observed by a noticeable increase of 1.8‰ between 642.25 and 641.8 m in this study and 641.7 m in Kuypers et al. (1999). The A/B limit, marked by the first highest value of δ13C recorded after the PCE, is located before 640 m, probably close to 639.8 m rather than at 640.1 m, as initially proposed by Kuypers et al. (2002). This new evolutionary frame agrees with data reported by Forster et al. (2007), which record the highest value of δ13Corg of −21.6‰ at 639.9 m. Our results confirm that, as in other sites, the cooling, associated to the PCE, started after the onset of the P-CIE and the lowest temperature is recorded close to the isotopic A/B limit.
Organic Matter Source and Maturity
Both the Corg (%) and TOC (%) values calculated from carbonate free fraction and from bulk-rock by Rock-Eval pyrolysis show important enrichment of OM content (up to 55%, at 640.35 m). In both signals, a noticeable increase of organic carbon content, coeval with the onset of OAE-2 and associated with the δ13Corg positive excursion, is observed from 642.0 m.
As shown in the modified van Krevelen diagram (Figure 7A), most samples have HI values higher than 400 mg HC/g TOC and are characterized by low OI values, which never exceed 65 mg CO2/g TOC. In detail, pre-OAE-2 samples, with TOC mostly lower than 10%, record HI values lower than 350 mg HC/g TOC and OI values upper than 45 mg CO2/g TOC. In the modified van Krevelen diagram, these values plot in the Type II and Type III domain, consisting theoretically of a mix of marine and terrestrial material. However, as demonstrated by previous studies based on molecular fossils (Kuypers et al., 1999; Kuypers et al., 2002; Sinninghe Damsté et al., 2008), OM is thought to have a dominant marine origin, even before the OAE-2. Molecular fossils of unambiguous terrestrial origin (i.e., leaf wax lipids and oleoananes) are present only in low abundance in the extractable OM (Kuypers et al., 2002). For these samples, it is likely that the marine OM had been partially oxidized with a consequence of a lowering of HI. The samples within the OAE-2 record the highest values of HI (up to 730 mg HC/g TOC) and the lowest values of OI (down to 30 mg CO2/g TOC). For theses samples, these range of HI and OI values correspond to OM of Type II (marine origin), deriving from algal and bacterial sources. These data confirm the first results obtained by Herbin et al. (1986) on this site. Based on the significant covariation of δ13Corg with δ13C of the extended hopanoids and sulfur-bound phytane (r = 0.91), Kuypers et al. (2004) argue for the predominance of cyanobacteria in the phytoplanktonic community and thus in the sedimentary OM. The Tmax values oscillate between 392 and 418°C, clearly indicating an immature OM (Figure 7B), hence a shallow burial of sediments. This result is in good agreement with the preservation of molecular fossils (see Kuypers et al., 2002; Sinninghe Damsté et al., 2008) within the studied site and indicates that the burial diagenesis might have been limited.
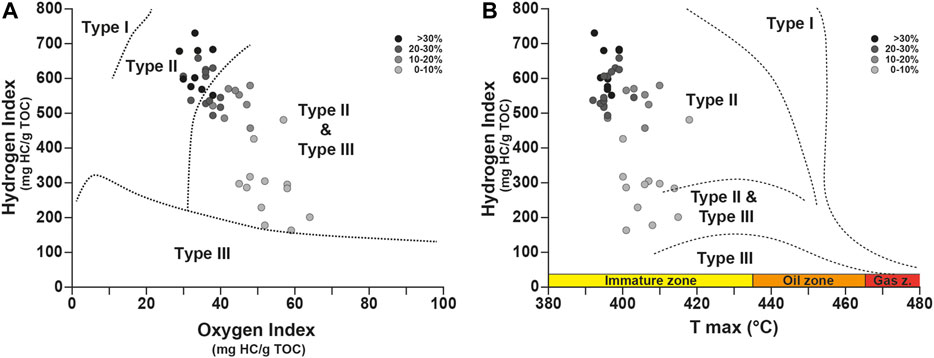
FIGURE 7. Cross-plots of Hydrogen Index (HI) versus Oxygen Index (OI) (A) and versus Tmax(B).
Evolution of the Oxygenation Conditions and of the Water Mass Restriction During the Oceanic Anoxic Event 2
Among the DSDP-ODP-IODP sites from the Central Atlantic, the DSPD site 367 is usually considered as being continually overlain by anoxic to euxinic water masses during the late Cenomanian times (Dickson et al., 2016). This is based on high value of Corg/Ptotal ratio (mostly >106; up to 1,536) and high values of Mo concentration (mostly >40 ppm and up to 630 ppm) obtained from previous studies (van Helmond et al., 2014a; Dickson et al., 2016). Occurrence of isorenieratene and chlorobactene, two biomarkers associated with sulfur phototrophic bacteria, within the OAE-2 interval would indicate that H2S extended at least episodically into the photic zone (Sinninghe Damsté and Köster, 1998; Kuypers et al., 2002; Pancost et al., 2004; Sinninghe Damsté et al., 2008). By compiling and comparing the geochemical data (δ15Ntotal, Corg, trace metal concentrations) obtained as part of this study and from previous reports (Kuypers et al., 2002; Kuypers et al., 2004; Forster et al., 2007; van Helmond et al., 2014a; Westermann et al., 2014; Dickson et al., 2016) and unpublished data from H-J Brumsack for selected elements (Fe, Mn, P, Cu, Ni, Co, Zr), we propose below to bring further details in the oxygenation evolution of the DSDP site 367.
In the core 19, the El/Al record is only marked by a peak value at 648.0 m for some elements (V, Zn, Cd, Cu, U), associated to the first noticeable peak of Corg (29.3%), low values of δ15Ntotal (−1.8‰) but without perturbation of δ13Corg signal (Figures 4,5). All of these elements being redox-sensitive, it is likely that this short level of increasing OM burial, recorded few meter before the onset of the OAE-2, was associated to a short-term interval of O2-depeted conditions. The peak of 2-methylhopanoid index, used as a marker of cyanobacterial oxygenic photosynthesis (Summons et al., 1999) recorded at 647.95 m in Kuypers et al. (2004) and the absence of isorenieratane, a biomarker of green sulfur cyanobacteria (Kuypers et al., 2002) argue for a well oxygenated photic zone. The water column extension of O2-depleted conditions during this interval was probably limited, close to the sediment/water interface. The use of redox ratios, such as U/Th and V/Cr can further constraints the oxygenation level. Based on the dysoxic/anoxic thresholds (1.25 for U/Th, 4.25 for V/Cr), defined by Jones and Manning (1994), these ratios indicate anoxic conditions (Figure 8). Unfortunately, due to poor resolution of sampling around 648.0 m, the lower and upper limits of this interval cannot be precisely defined. Except for this short-term interval, the rest of the core 19 corresponds to dysoxic conditions.
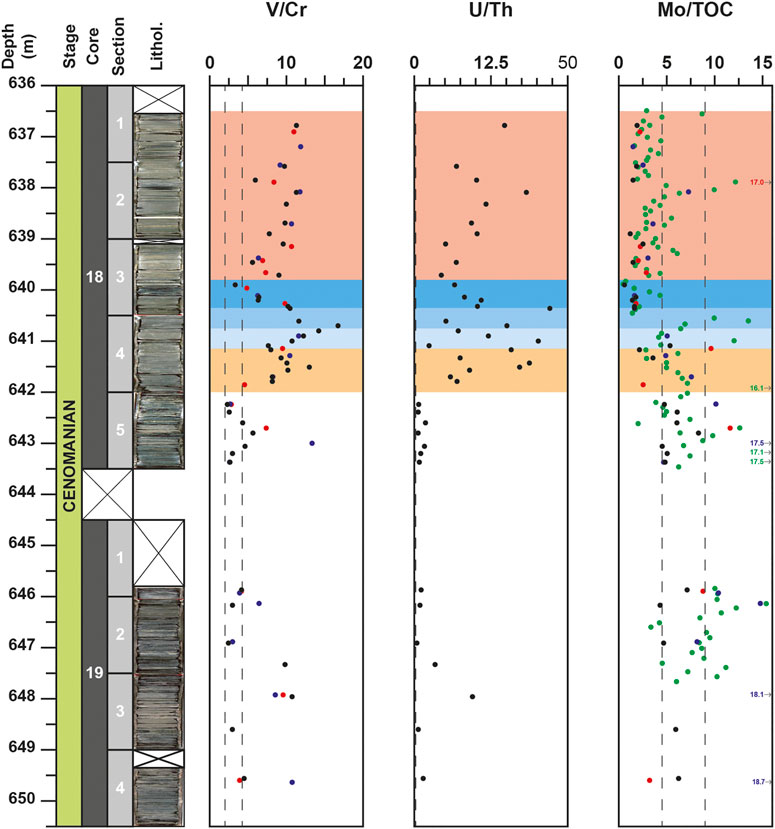
FIGURE 8. Depth-profiles for V/Cr, U/Th and Mo/Corg redox ratios for the DSDP site 367. Data from the studies of Kuypers et al. (2002) and Kuypers et al. (2004), Westermann et al. (2014) and Dickson et al. (2016) are represented with blue, red and green circles respectively. Vertical dotted lines represent the threshold values (2.0 and 4.25 for V/Cr and 0.75 and 1.25 for U/Th) defined by Jones and Manning (1994) to distinguish oxic, dysoxic and anoxic conditions.
In the core 18, the concentrations of O2-sensitive elements (Mo, U, V, Zn, Ni) exhibit fluctuating values within the interval depth corresponding to the OAE-2 (642.0–636.5 m). The base of the OAE-2 (642.0–640.3 m), corresponding to the onset of δ13C excursion, and the PCE-1-PCE-2 interval, is characterized by a progressive and noticeable increase in El/Al ratio for most of the RSTE (e.g., V, U, Ni) with peak value interval recorded around 640.5 m (Figure 4). Similar evolutions are observed for the redox V/Cr and U/Th ratios (Figure 8). The coeval increase of TOC values and most of the RSTE, associated with low values of δ15Ntotal (mainly < −1.5‰), clearly indicate the onset of anoxic to euxinic conditions in the water column (Figures 2,4). The extent of O2-depleted conditions is supported by cyanobacterial biomarkers (Kuypers et al., 2002). In this interval (642.0–640.35 m), the punctual occurrence of isorenieratane, associated with highest values of P, Cd and Cu (Figure 5) argue for an euxinic photic zone, which could be the result of an increase of O2 demands by the phytoplankton associated with a rise of the chemocline to shallower depths (Kuypers et al., 2002).
This 1.5 m thick interval is followed by a 55 cm thick interval (640.35–639.80 m), corresponding to the PCE-3, that is underlined by an important drop of most of the RSTE (Mo, U, V, and Zn) for both concentrations and El/Al ratios, coeval with a decrease of TOC values of ∼20% and an increasing trend of δ15Ntotal values up to −1.2‰ (Figures 2,4). A similar organic-poor interval, characterized by low trace metal concentrations, was previously recorded in proto-North Atlantic deep sites: 1276 and 603 (van Helmond et al., 2014a) but never recognized at DSDP site 367. This short interval was interpreted at ODP sites 1276 and 603 as a temporary reoxygenation event of the bottom waters as a consequence of the PCE (van Helmond et al., 2014a). At the DSDP site 367, this interval (640.35–639.80 m) strictly correspond to the stratigraphic level where the lowest values of TEX86 were recorded by Forster et al. (2007) arguing for a cooling of see surface temperature episode and where a decrease of isorenieratane concentration was observed at 640.11 m in Kuypers et al. (2002). In this deeper site, the PCE thus likely triggered a transient decrease in concentration of dissolved H2S in the photic zone and in bottom-water as well. The PCE would thus be associated to a short-term return toward non-euxinic conditions. This perturbation of redox conditions may have altered partially or totally the conversion of Mo, V, and Zn to thiomolybdates, oxides (V2O3 and V(OH)3) and sulfides (ZnS), respectively (Tribovillard et al., 2006) and can account for noticeable decrease of El/Al ratio observed for most of the RSTE during this interval. As an alternative to redox perturbation, enhanced drawdown of seawater trace metal reservoir has been suggested to explain the sizeable decrease of O2/H2S sensitive elements, as documented for two deep ODP sites (1258 and 1260) located in the south-western part of the Central Atlantic at Demerara Rise (Hetzel et al., 2009). For these two sites, the decline of elements concentrations is observed during the entire OAE-2, whereas for the DSDP site 367, this decline is observed only at the end of the P-CIE (for few elements, as Zn, Cu, and Cd continuing in the plateau interval). Most O2/H2S sensitive elements show either a slight enrichment in the plateau interval (e.g. Mo and U) or noticeable enrichment (e.g. V, Ni, and Fe) with the highest value recorded within the plateau interval at 638.1 m (Figures 4, 6). The contrasted behavior of these elements between the DSDP site 367 (Cape Verde) and the ODP sites 1258–1260 (Demerara Rise) argue for a transient decrease in concentration of dissolved H2S, associated to the PCE rather than for a drawdown of seawater trace metal reservoir at a global or regional scale. This transient episode of reoxygenation indeed likely replenish trace metals (Jenkyns et al., 2017). This inference is strengthened by the evolution of the Corg/P total ratio and the δ15Ntotal signal (Figures 2,3), which show respectively extremely high values (>1,000) and low values (<−1.6‰) within the plateau interval (this study) and by the high concentration of isorenieratane (>50 mg/g TOC) and high percentage of 2-methylhopanoid (>15%; Kuypers et al., 2004). All the geochemical data suggest that after a short-term episode of H2S depletion during the PCE, the water column returns to anoxic-euxinic conditions during the plateau interval. Under these conditions, remobilization and regeneration of some elements like P (phosphate or organic phosphorus) and Ba (barite), during OM remineralization by sulfate reducing bacteria may occur (Van Capellen and Ingall, 1994; Krall et al., 2010). In contrast, in the presence of H2S some other elements may form insoluble sulfide phase (CuS, CuS2, CdS) or may be incorporated as solid solution (ZnS, NiS, CoS) in pyrite (FeS) (Huerta-Diaz and Morse, 1992). The absence of noticeable enrichment of Cu and Cd compared to those observed for Ni, Co and Fe suggests a preferential co-precipitation with FeS.
Since the work of Algeo and Lyons (2006) on the covariations of TOC and Mo concentration in modern euxinic basins (i.e., Black Sea, Cariaco Basin), the Mo/TOC ratio is considered as a reliable proxy to estimate intensity of restriction of water mass in silled basins and renewal time of the deep-water mass. By compiling all the Mo/TOC data for the DSDP site 367 (Kuypers et al., 2002; Westermann et al., 2014; Dickson et al., 2016; this study), an abrupt decrease of this ratio is clearly evidence from 440.5 m, with values mainly lower than 2.25 up to 636.5 m depth (Figure 8). This protracted shift toward lower values reflects a decline of Mo concentrations (mainly <100 ppm), associated to an increase of OM preservation (with TOC values >25%) recorded in samples from the top of the P-CIE (P-CIE-3) and the plateau intervals of the DSDP site 367. In details, the lowest values of Mo/TOC ratio are mainly recorded in the 1-m thick interval (640.5–639.5 m) corresponding to the PCE. This event, which lasted 40–65 kyr (O’Connor et al., 2020), record a reoxygenation of deep and shallow water domain and a cooling event (drop in sea-surface temperature of ∼2.5–5.5°C, Forster et al., 2007) and likely corresponds here to an episode of water-masses renewal. We suggest that during this short-term event, the concentration of H2S was too low to convert molybdate anions to particle-reactive thiomolybdates. Accordingly, we suggest that the low Mo/TOC values observed for the Cape Verde sediments during the PCE reflect an anoxic unrestricted environment, associated with dynamic water masses such as upwelling system rather than a restricted silled basin. For the remaining of the sedimentary record of the OAE-2, the Mo/TOC values mainly oscillate from 1 to 10 with an average value around 4.4, close to the regression slope value of 4.1, proposed by van Helmond et al. (2014a) for the deep proto-North Atlantic and the reference value of 4.5 obtained for the Black Sea (Algeo and Lyons, 2006), suggesting a water mass renewal period longer than 500 years.
General Framework of Nitrogen Isotope Signals Interpretations During the Oceanic Anoxic Event 2
Widespread changes of oxygen availability in the water column during the establishment of the OAE-2 have sensibly affected the cycle of N, which is considered as the main limiting nutrient with P and Fe. In general, extended anoxic conditions lead to an enhanced nitrogen loss through denitrification and ammonium oxidation processes, in which case an anoxic bottom part of the water column becomes NH4+-rich and N2-fixation could overcome nitrate limitation to support biological productivity. Isotopic fractionation associated with atmospheric N2-fixation by diazotrophs being low, the δ15Ntotal values could tend towards ∼0‰.
Changes of bioavailable dissolved nitrogen δ15Ntotal over geological times mainly reflect the balance between the dominant nitrogen metabolic pathways regulating the nitrogen cycle alongside the water column structure (Sigman et al., 2009; Thomazo and Papineau, 2013; Ader et al., 2016; Stüeken et al., 2016). The Cretaceous Period is overall characterized by an elevated sea level and a warm climate, both affecting the water column stratification and dynamics and thus impacting the evolution of the sedimentary δ15Ntotal. Indeed, sea level variation is known to potentially change the locus of denitrification in oceanic settings (Deutsch et al., 2004). High sea level appears to enhance organic carbon burial in highly productive continental shelves by favouring sedimentary denitrification (Algeo et al., 2014). However, this highlighted correlation between sea level elevation and sedimentary δ15Ntotal evolution through Greenhouse/Icehouse period might require to be nuanced concerning the OAE-2. Indeed, during this widespread anoxic event, numerous continental shelf environments appear to also evidence water column anoxic condition and hence active water column denitrification. It was also suggested that during the mid-Cretaceous Greenhouse period, high sea levels and the continental configuration favoured the formation by evaporation of warm and saline water masses in low latitude, inducing the formation of deep-water masses (Brass et al., 1982; Friedrich et al., 2006). This process could have favoured water column mixing and thus facilitated the input of NH4+-rich water masses to the surface. It probably occurred during the onset of the OAE-2 but was interrupted or at least highly reduced during the PCE, due to reduced evaporation and drier climate.
At the DSDP site 367, the low and negative δ15Ntotal values (0 to −2.3‰) confirm the data previously obtained by Kuypers et al. (2004), and are consistent with the mainly negative δ15Ntotal values reported in proto-North and Central Atlantic sites recording the OAE-2 (e.g., ODP sites 1260; 1261 and 1276), with δ15Ntotal mostly comprised between −4 and 2‰ (Jenkyns et al., 2007; Junium and Arthur, 2007; Ruvalcaba Baroni et al., 2015). These isotopic values associated with elevated 2-methylhopanoid ratio at the DSDP site 367 have been initially attributed to a significant uptake of N2 by diazotrophs (Kuypers et al., 2002). Such low δ15Ntotal values are, however, significantly lower than δ15Ntotal values observed in modern anoxic basins (e.g. Black Sea, Cariaco Basin) in which N2-fixation is known to be significant (Fry et al., 1991; Thunell et al., 2004). To explain these negative δ15Ntotal values, it was suggested that upwelling of anoxic and ammonium-rich deep waters have supported biological productivity by providing dissolved fixed-nitrogen to primary producers (Higgins et al., 2012).
During the OAE-2, deep oceanic settings, as the DSDP site 367, can indeed build up a large reservoir of NH4+, which can be the main N source for primary production (ammonia ocean scenario of Higgins et al., 2012). In such scenario, a combination of denitrification and anammox reactions at the chemocline quantitatively consumes the nitrate and nitrite reservoir, the primary productivity being supported by advection of 15N-depleted NH4+, as well as other nutrient elements like PO43-, from deep water up to the photic zone, especially during chemocline upward excursions. The 15N-depleted NH4+ can be consumed through ammonium assimilation and ammonium oxidation (i.e., nitrification), which are both associated to a sizeable isotopic fractionation that generate a 15N-depleted product and 15N-enriched residual NH4+ reservoir. If the fractionation associated with ammonium assimilation outcompetes the isotopic enrichment caused by the combination of anammox/denitrification/nitrification processes, the biomass remains isotopically negative.
Alternative nitrogenases to N2-fixation using Fe and V rather than Mo as enzymatic co-factor was also proposed to explain δ15Ntotal values lower than −2‰ recorded during OAE-2 in the proto-North and Central Atlantic sites (Zhang et al., 2014). In this scenario, Mo is replaced in the active site of the metalloenzyme by Fe or V in response of the global oceanic drawdown of trace metals (especially Mo). These alternative nitrogenases can be expressed either by cyanobacteria in the photic zone or by anoxygenic phototrophs and would be favored during period of increase in the Fe/Mo ratio possibly linked to enhance hydrothermal activity and Mo scavenging. However, no clear difference is observed between Mo and Fe in a scatterplot with δ15Ntotal values (Figure 9) in our dataset. Both elements are characterized by a nonlinear negative correlation with δ15Ntotal. Moreover, the alternative nitrogenase hypothesis implied a large δ15N fractionation down to −7‰, while the minimum value recorded at DSDP site 367 is −2.3‰. We therefore suggest that the contribution of N2-fixation through an alternative nitrogenase while possible could only represent a small proportion of δ15Ntotal signal, due to both 1) mass balance considerations and 2) the reported high abundance of eukaryotic biomass at Demerara Rise, in a similar paleogeographical context and with equivalent δ15N values during OAE-2 (Higgins et al., 2012).
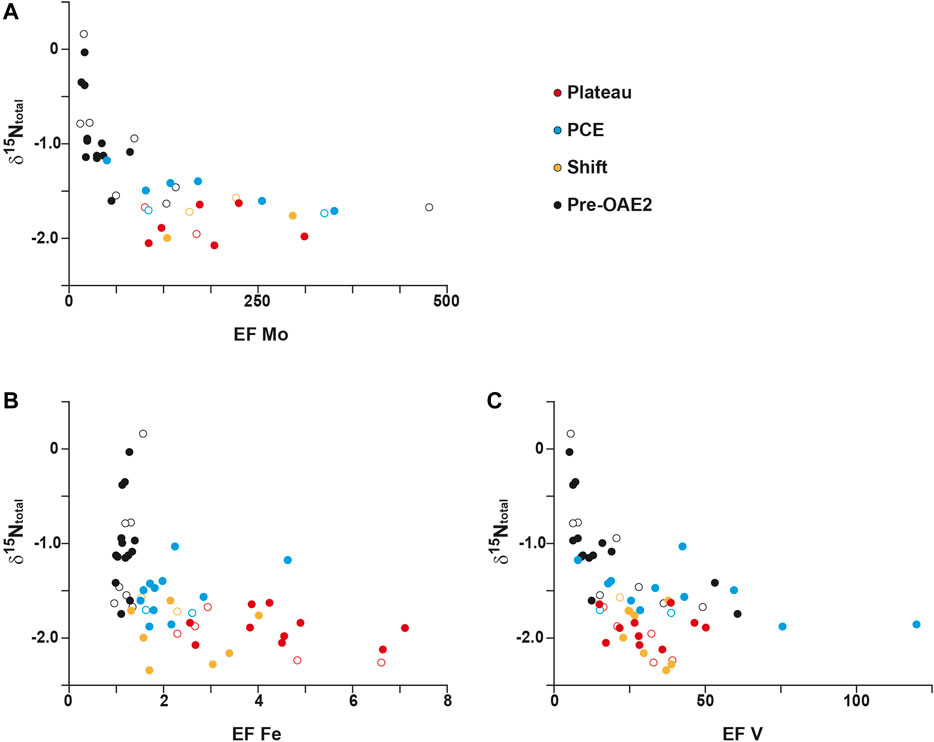
FIGURE 9. Cross-plot of isotopic nitrogen compositions δ15Ntotal versus, EF Mo (A); EF Fe (B) and EF V (C) Open symbols correspond to the data from the study of Kuypers et al. (2002) for Mo and V and from unpublished data of H-J. Brumsack for Fe.
Our δ15Ntotal data, at the first order, seem to agree with the proposed combination of 15N-depleted ammonium assimilation and N2-fixation to explain the low and negative isotopic values observed. Moreover, our high-resolution δ15Ntotal analysis revealed significant short-term δ15Ntotal variations related to physical and chemical changes associated to both the OAE-2 and the PCE which are discussed below.
High Resolution Nitrogen Isotopes Variations Across Oceanic Anoxic Event 2 and Plenus Cold Event Records at Cape Verde
Pre-Oceanic Anoxic Event Nitrogen Cycle
The specificity of the Central Atlantic is to show evidences of deoxygenated conditions before the OAE-2. In the Cape Verde basin, this pre-OAE deoxygenation is expressed by continuous high amount of OM, detectable authigenic enrichments (3 < EF < 10) of most RSTE and evidences of an active phosphorus regeneration. Besides, high Mo enrichments compared to U suggest an active “Particulate shuttle” effect in water column (Figure 10), as reported for modern semi-enclosed basins (Algeo and Tribovillard, 2009; Tribovillard et al., 2012), hence suggesting that a strong and deep chemocline discriminates a well oxygenated upper water column from anoxic bottom waters. The redox conditions were, however, not stable during this Pre-OAE time, and periods of stronger deoxygenation standout such as within the section 3 of the core 19.
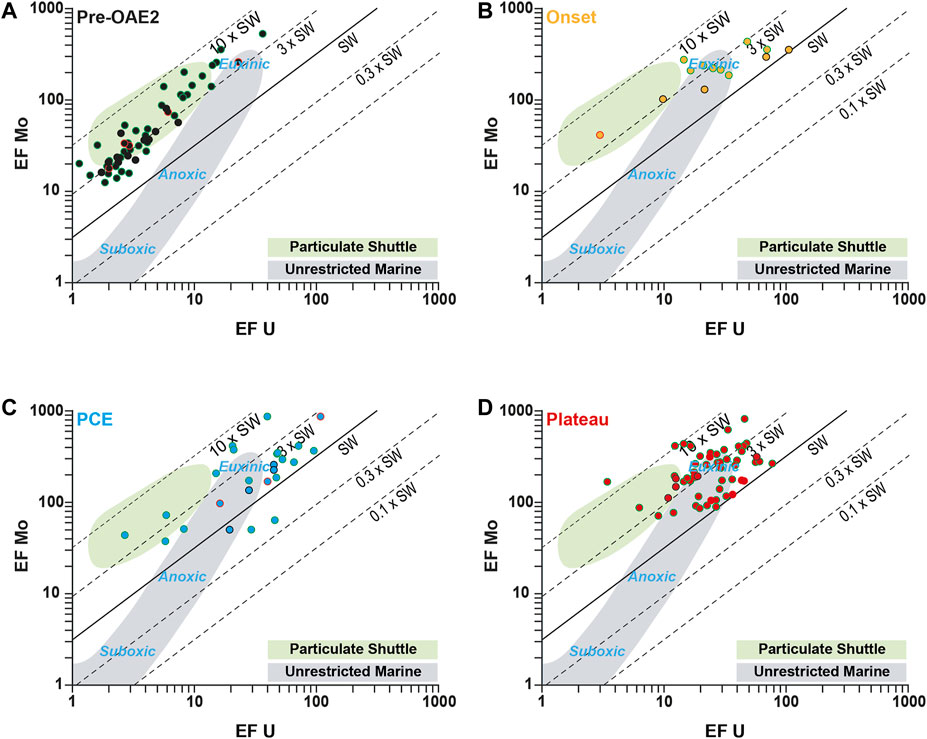
FIGURE 10. Cross-plot of EF U versus, EF Mo for the Pre-OAE-2 interval (A), the onset interval (B), the PCE interval (C) and the plateau interval (D). Data from the studies of Westermann et al. (2014) and Dickson et al. (2016) are represented with circles with red and green outline respectively.
During this pre-OAE interval, constantly negative δ15N values (−1.2 to 0‰) indicate that N2-fixation outcompetes NO3− limitation in the photic zone (Figure 11). Within the framework of a stratified water column, quantitative N loss due to the combination of nitrification, heterotrophic denitrification and anammox occur at the chemocline while NH4+ could accumulate in the deeper basin.
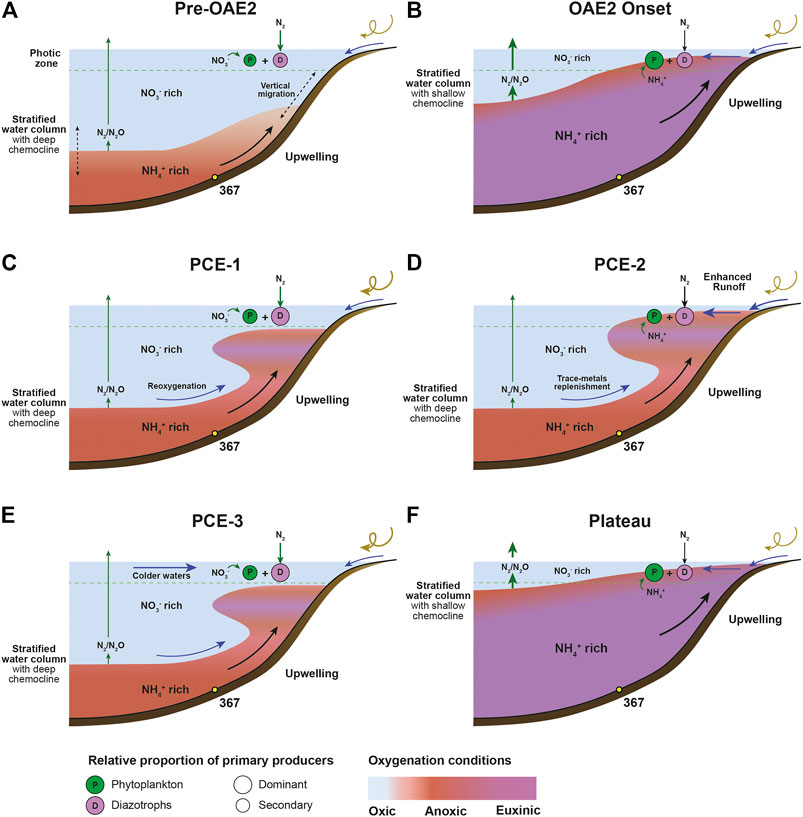
FIGURE 11. Schematic representation of the nitrogen cycle and the resulting nitrogen isotopic imprint of marine sediments: Before the OAE-2 (A), during the OAE-2 onset (B), during the PCE-1 interval (C), during the PCE-2 interval (D), the PCE-3 interval (E), during the plateau interval (F). The red color indicates anoxic waters, the purple color euxinic waters and the blue color oxygenated waters (modified from Ader et al., 2014).
While being presumably stratified before the OAE-2, oceanographic models (Trabucho Alexandre et al., 2010; Topper et al., 2011) proposed that during the mid-Cretaceous time the Southeastern part of the Central Atlantic basin was characterized by the presence of upwelling currents along margins bringing NH4+ rich waters from the deep ocean toward the surface, transiently reaching the photic zone. Anoxia in the photic zone preceding the OAE was previously proposed to account for punctual isorenieratane occurrences (Kuypers et al., 2002). In addition to the long term stratification of the Cape Verde basin, delivery of 15N-depleted NH4+ in the photic zone from more proximal areas may have been assimilated by the phytoplankton and consequently participate to the lowest δ15N values observed in the section 3 of the core 19 (down to −1.75‰). Other possible mechanisms of deep-water advection into the surface include eddy-circulation, which may have been particularly relevant of the mid-Cretaceous ice-free climate regime (Hay, 2008).
Oceanic Anoxic Event 2 Nitrogen Cycle
At DSDP site 367, the first δ13C buildup and the plateau interval within the OAE-2 are characterized by an intensification of the deoxygenation as demonstrated by the substantial authigenic enrichment of the RSTE (e.g., U, Ni, V) leading to euxinic conditions in the basin. Large proportions of sulfide in the water column are also evidenced by exceptionally intense P recycling rate, marked by high Corg/Ptotal values (this study) and by a rapid positive excursion of the δ98/95Mo (Westermann et al., 2014; Dickson et al., 2016), towards the typical seawater composition. The shallowing of the chemocline, and hence the invasion of the euxinic conditions from the bottom waters to the photic zone, was also demonstrated by the large concentrations of isorenieratane measured along the OAE-2 and mostly during the plateau interval (Kuypers et al., 2002).
At DSDP site 367, the Mo vs. U enrichments during the onset of the OAE-2 and the plateau intervals are mostly located in the “Euxinic” zone or even higher (Figure 10). Thus, the EF Mo/EF U values decrease during the two episodes of extreme deoxygenation approaching the values of today’s seawater (∼7.7). Significantly, while the plateau interval is the period characterized by the most intense and the most prolonged deoxygenated conditions of the OAE-2, enrichments in some RSTE as Mo, U or V are lower in this interval than during PCE, conversely to Fe. This observation, combined with low Mo/TOC values, suggests a drawdown of these elements in the water-column due to their scavenging in the sediments at the basin scale.
In the proto-North and Central Atlantic sites, negative δ15Ntotal values during the OAE-2 has been largely reported in every part of the ocean (Kuypers et al., 2004; Junium and Arthur, 2007; Higgins et al., 2012; Ruvalcaba Baroni et al., 2015). This negative signal is consistent with a combination of both N2-fixation and NH4+ partial assimilation processes in the N export production. While both N2-fixation and NH4+ assimilation were important in the nitrogen exported production, a general lowering of the δ15Ntotal value from North to South suggests that the NH4+ assimilation was particularly significant in the southern part (Ruvalcaba Baroni et al., 2015; Naafs et al., 2019) and could have been dominant, as evidenced by Higgins et al. (2012). The high Corg/Ntotal ratio, observed in the DSDP 367 site indicates an intense biological removal of amino groups from the OM in the sediments, releasing NH4+. The diffused NH4+ from the sediments would have further supplied a water column ammonium reservoir.
At DSDP site 367, the evolution of the δ15Ntotal is fully consistent with the convecting redox-stratified ocean model proposed by Ader et al., 2014; Ader et al., 2016) where NH4+ invades the entire basin and NO3− reservoir is substantially reduced and limited in the photic zone far away from the coastal area (Figure 11). The limited δ15Ntotal fluctuations during the plateau interval would therefore represent variations in the relative proportions between the eukaryotic and the denitrifying biomasses, which would be controlled by the position of the chemocline through the lower limit of the photic zone. The large variations in the Fe enrichments are coherent with fluctuations of the H2S inventory of the water-column chemocline. Redox fluctuations with a similar pace were previously evidenced by oscillating δ98/95Mo, that were interpreted as the expression of orbital cycles controlling the continental-weathering and the delivery of nutrient in the basin (Dickson et al., 2016), suggesting a climate influence on oxygenation conditions and nitrogen cycle. Comparable variations in Fe chemistry, Corg/Ptotal ratio (Poulton et al., 2015) and δ98/95Mo variations (Goldberg et al., 2016) with those measured in the Cape Verde Basin were evidenced along the same continental margin in the Tarfaya Basin (Offshore Morocco), in a shelf setting. This observation highlights that the redox fluctuations described in the deep Cape Verde Basin are consistent with shallower settings and confirm that they are constrained by the regional redox structure of the entire southern proto-North Atlantic domain. Besides, continuous O2-depleted conditions at intermediate bathymetry (>1,000 m for the deepest site) from pre-to post-OAE-2 at Demerara Rise (Hetzel et al., 2009) suggest that an expanded Oxygen-Minimum Zone impinged the southern part of the proto-North Atlantic, and we suggest that upwelling currents were active through the Cenomanian-Turonian interval in this region.
Nitrogen Cycle During the Plenus Cold Event
The high resolution of the δ15Ntotal signal measured along the section not only allowed to distinguish the PCE during the OAE-2, but also to highlight large variations characterizing a complex N cycle during this swing in temperature. Indeed, the PCE interval is particularly well underlined by two spikes of heavier δ15Ntotal values recorded during the PCE-1 and PCE-3. This period was also previously associated with a deepening of the chemocline based on a drop in the δ98/95Mo values (Dickson et al., 2016). However, still high enrichments in Mo, and in a lesser degree in U, argue for persistent anoxic to euxinic deep waters (Figure 10). Active upwelling currents bringing nutrients rich waters to the surface, hence maintaining a high primary production and Corg export to the sediments may have promoted the formation of an oxygen rich intermediate water mass along the Cape Verde basin margin.
We suggest that PCE-1 represents a period of better-ventilated intermediate waters. The rapid and large increase in δ15Ntotal within the PCE-1 (+1.3‰) is consistent with a switch in the nitrogen cycle with higher ratio of nitrate vs ammonium assimilation the former expanding due to upwelling of oxygenated water masses (Figure 11). In both cases however, N2-fixation likely represents the main source of N for primary producers, δ15Ntotal remaining close to 0‰ value, as expected in stratified settings (Figure 11).
The PCE-2 is associated with lower δ15Ntotal values (∼−1.8‰) and many trace metal (Cd, Cu, Ni, V, Zn) enrichments (Figures 3–5). Such enrichments in an overall period of reoxygenation has previously been reported in the Western Interior Seaway (Eldrett et al., 2014) or in the English Chalk (Jenkyns et al., 2017), and were either interpreted has the advent of waters rich in hydrothermally-derived elements or by basin-scale re-oxidation of previously deposited organic- and sulfide-rich sediments. Oxygenated water masses may have been restricted “in sandwich” between two ammonium rich and nitrate poor water masses and the overall nitrogen cycle back to an isotopic signal of N2-fixation and NH4+ partial assimilation state on proximal margin.
The second peak of heavier δ15Ntotal values in the PCE-3 is accompanied with both a drop in sea-surface temperature (Forster et al., 2007) and a reoxygenation of the basin as demonstrated by the lowest trace metal enrichments. This transient cooling and reoxygenation may have cause a deepening of the chemocline and increase in the contribution of nitrate to the nitrogen isotope sedimentary signal. Compared to long-term secular variations observed during greenhouse-icehouse periods (Algeo et al., 2014), the PCE nitrogen cycling point out to a more complex picture. Indeed, if water column denitrification can expand during the PCE and imprint the geochemical sedimentary record due to an increasing contribution of cycled nitrate to the biomass, we suggest that associated changes in the δ15Ntotal signal are primarily controlled by the ratio of bioavailable ammonium to nitrate rather than a change in the locus (sedimentary vs water column) of denitrification. This inference is supported by recent results of Earth System model which demonstrates that during the OAE-2 fundamental transitions in the species of nitrogen dominating the fixed-N inventory, from nitrate to ammonium across deoxygenation, are anticipated (Naafs et al., 2019).
Conclusion
By combining newly generated and existing geochemical data from the DSDP site 367, our integrated study:
-confirms the burial of organic matter, dominantly marine in origin, associated to a positive carbon isotopic excursion of ∼6.0‰. For this isotopic excursion, a detailed sequencing of δ13C evolution has been proposed and a new subdivision within the Plenus carbon isotopic excursion in three sub-intervals (PCE-1, PCE-2, and PCE-3) is suggested.
-highlights the fluctuations of oxygenation in the water column especially during the Plenus carbon isotopic excursion for one the deepest site in the Central Atlantic. After a period of stability in concentration of redox sensitive trace elements and high δ15Ntotal values (>−1.2‰), characterized by dysoxic to anoxic conditions before the OAE-2, the onset of this event, marked by noticeable enrichment of these elements and the lowest δ15Ntotal values (<−2.0‰), is associated to euxinic conditions in bottom water. Within the OAE-2, the Plenus carbon isotopic excursion is associated to short-term O2/H2S fluctuations and three settings are distinguished. The PCE-1, characterized by decreasing trend of δ15Ntotal values and contrasted record of redox sensitive trace elements, would correspond to a period of better-ventilated intermediate waters. The PCE-2, marked by noticeable enrichment of these elements and the lower δ15Ntotal values (∼−2.0‰), is characterized by water column O2-depleted conditions, associated to potential hydrothermal enrichments. The PCE-3, marked by noticeable decreasing trend of both δ15Ntotal values and redox sensitive trace elements, is interpreted as an interval of reoxygenation of water column, probably linked to input of cooler and oxygenated water from high latitudes. Lastly, the plateau interval is marked by the invasion of the euxinic conditions from the bottom waters up to the photic zone.
-discusses for the first time the impact of the Plenus Cold Event on the nitrogen cycle for this site and a model for the nitrogen cycle and the resulting nitrogen isotopic imprint of marine sediments is proposed. Before the OAE-2, a stratified water column model and a deep and strong chemocline, prevailed in NH4+-rich bottom water. The onset of the OAE-2 is characterized by the development in the water column of euxinic NH4+ rich water masses, and a restriction of the NO3− reservoir to the photic zone. These nitrogen cycle settings changed during the short-term climatic variations associated with the Plenus Cold Event. During cooling, a reoxygenation phase of the intermediate water due to active upwelling currents and accompanied by a deepening of a sulfide-rich chemocline temporally reshaped both the carbon and nitrogen cycles. These changes are remarkably well expressed in the nitrogen isotope record with swings in the δ15Ntotal values, interpreted here as a tracer of ammonium to nitrate bioavailable inventory.
Data Availability Statement
The original contributions presented in the study are included in the article/Supplementary Materials, further inquiries can be directed to the corresponding author/s.
Author Contributions
PC performed the isotopic geochemical analysis and FB performed the organic geochemical analysis. LR, PC, FB, CT, and JD contributed to the interpretation of the results. LR organized the database and wrote the first draft of the manuscript. LR, PC, JD, and CT wrote sections of the manuscript. All authors contributed to manuscript revision, read, and approved the submitted version.
Conflict of Interest
The authors declare that the research was conducted in the absence of any commercial or financial relationships that could be construed as a potential conflict of interest.
Publisher’s Note
All claims expressed in this article are solely those of the authors and do not necessarily represent those of their affiliated organizations, or those of the publisher, the editors and the reviewers. Any product that may be evaluated in this article, or claim that may be made by its manufacturer, is not guaranteed or endorsed by the publisher.
Acknowledgments
We would like to thank Florence Savignac for her analytical assistance for Rock-Eval analysis, Marie-Jeanne Milloux for organic isotope measurements and Alexandre Lethiers for illustration support. Hans-Jürgen Brumsack is kindly thanked for sharing unpublished data for selected major and trace elements. We also thank J-C M-S and Y-U Z for providing constructive comments. This research used samples provided by the International Ocean Discovery Program. This study was funded by the project Anox-Sea ANR-12-BS06-0011 coordinated by EP. Data from this study can be found in the supplementary data file.
Supplementary Material
The Supplementary Material for this article can be found online at: https://www.frontiersin.org/articles/10.3389/feart.2021.703282/full#supplementary-material
References
Ader, M., Sansjofre, P., Halverson, G. P., Busigny, V., Trindade, R. I. F., Kunzmann, M., et al. (2014). Ocean Redox Structure across the Late Neoproterozoic Oxygenation Event: a Nitrogen Isotope Perspective. Earth Planet. Sci. Lett. 396, 1–13. doi:10.1016/j.epsl.2014.03.042
Ader, M., Thomazo, C., Sansjofre, P., Busigny, V., Papineau, D., Laffont, R., et al. (2016). Interpretation of the Nitrogen Isotopic Composition of Precambrian Sedimentary Rocks: Assumptions and Perspectives. Chem. Geology 429, 93–110. doi:10.1016/j.chemgeo.2016.02.010
Algeo, T. J., and Lyons, T. W. (2006). Mo-Total Organic Carbon Covariation in Modern Anoxic marine Environments: Implications for Analysis of Paleoredox and Paleohydrographic Conditions. Paleoceanography 21, PA1016. doi:10.1029/PA00111210.1029/2004pa001112
Algeo, T. J., and Tribovillard, N. (2009). Environmental Analysis of Paleoceanographic Systems Based on Molybdenum-Uranium Covariation. Chem. Geology 268, 211–225. doi:10.1016/j.chemgeo.2009.09.001
Algeo, T. J., Meyers, P. A., Robinson, R. S., Rowe, H., and Jiang, G. Q. (2014). Icehouse-greenhouse Variations in marine Denitrification. Biogeosciences 11 (4), 1273–1295. doi:10.5194/bg-11-1273-2014
Arthur, M. A., Dean, W. E., and Pratt, L. M. (1988). Geochemical and Climatic Effects of Increased marine Organic Carbon Burial at the Cenomanian/Turonian Boundary. Nature 335, 714–717. doi:10.1038/335714a0
Barclay, R. S., McElwain, J. C., and Sageman, B. B. (2010). Carbon Sequestration Activated by a Volcanic CO2 Pulse during Ocean Anoxic Event 2. Nat. Geosci. 3 (3), 205–208. doi:10.1038/ngeo757
Behar, F., Beaumont, V., and De B. Penteado, H. L. (2001). Rock-Eval 6 Technology: Performances and Developments. Oil Gas Sci. Technol. - Rev. IFP 56, 111–134. doi:10.2516/ogst:2001013
Blättler, C. L., Jenkyns, H. C., Reynard, L. M., and Henderson, G. M. (2011). Significant Increases in Global Weathering during Oceanic Anoxic Events 1a and 2 Indicated by Calcium Isotopes. Earth Planet. Sci. Lett. 309 (1–2), 77–88. doi:10.1016/j.epsl.2011.06.029
Bowman, A. R., and Bralower, T. J. (2005). Paleoceanographic Significance of High-Resolution Carbon Isotope Records across the Cenomanian-Turonian Boundary in the Western Interior and New Jersey Coastal plain, USA. Mar. Geology 217 (3–4), 305–321. doi:10.1016/j.margeo.2005.02.010
Brandes, J. A., and Devol, A. H. (2002). A Global Marine-Fixed Nitrogen Isotopic Budget: Implications for Holocene Nitrogen Cycling. Glob. Biogeochem. Cycles 16 (4), 1120. doi:10.1029/2001GB001856
Brass, G. W., Southam, J. R., and Peterson, W. H. (1982). Warm saline Bottom Water in the Ancient Ocean. Nature 296, 620–623. doi:10.1038/296620a0
Brumsack, H.-J. (2006). The Trace Metal Content of Recent Organic Carbon-Rich Sediments: Implications for Cretaceous Black Shale Formation. Palaeogeogr. Palaeoclimatol. Palaeoecol. 232, 344–361. doi:10.1016/j.palaeo.2005.05.011
Charbonnier, G., Boulila, S., Spangenberg, J. E., Adatte, T., Föllmi, K. B., and Laskar, J. (2018). Obliquity Pacing of the Hydrological Cycle during the Oceanic Anoxic Event 2. Earth Planet. Sci. Lett. 499, 266–277. doi:10.1016/j.epsl.2018.07.029
Chenet, P-Y., and Francheteau, J. (1979). “Bathymetric Reconstruction Method : Application to the Central Atlantic Basin between 10°N and 40°N,” in Deep Sea Drilling Project Initial Report (Washington, D. C: U.S. Gov. Print. Off.), 1501–1514. 51, 52, 53, Part 2.
Clarkson, M. O., Stirling, C. H., Jenkyns, H. C., Dickson, A. J., Porcelli, D., Moy, C. M., et al. (2018). Uranium Isotope Evidence for Two Episodes of Deoxygenation during Oceanic Anoxic Event 2. Proc. Natl. Acad. Sci. USA 115 (12), 2918–2923. doi:10.1073/pnas.1715278115
Danzelle, J., Riquier, L., Baudin, F., Thomazo, C., and Pucéat, E. (2018). Oscillating Redox Conditions in the Vocontian Basin (SE France) during Oceanic Anoxic Event 2 (OAE 2). Chem. Geology 493, 136–152. doi:10.1016/j.chemgeo.2018.05.039
Danzelle, J., Riquier, L., Baudin, F., Thomazo, C., and Pucéat, E. (2020). Nitrogen and Carbon Cycle Perturbations through the Cenomanian-Turonian Oceanic Anoxic Event 2 (∼94 Ma) in the Vocontian Basin (SE France). Palaeogeogr. Palaeoclimatol. Palaeoecol. 538, 109443. doi:10.1016/j.palaeo.2019.109443
Deutsch, C., Sigman, D. M., Thunell, R. C., Meckler, A. N., and Haug, G. H. (2004). Isotopic Constraints on Glacial/interglacial Changes in the Oceanic Nitrogen Budget. Glob. Biogeochem. Cycles 18. doi:10.1029/2003GB002189
Dickson, A. J., Jenkyns, H. C., Porcelli, D., van den Boorn, S., and Idiz, E. (2016). Basin-Scale Controls on the Molybdenum-Isotope Composition of Seawater during Oceanic Anoxic Event 2 (Late Cretaceous). Geochim. Cosmochim. Acta 178, 291–306. doi:10.1016/j.gca.2015.12.036
Du Vivier, A. D. C., Selby, D., Condon, D. J., Takashima, R., and Nishi, H. (2015). Pacific 187 Os/188 Os Isotope Chemistry and U-Pb Geochronology: Synchroneity of Global Os Isotope Change Across OAE 2. Earth Planet. Sci. Lett. 428, 204–216. doi:10.1016/j.epsl.2015.07.020
Eldrett, J. S., Minisini, D., and Bergman, S. C. (2014). Decoupling of the Carbon Cycle During Ocean Anoxic Event 2. Geology 42 (7), 567–570. doi:10.1130/g35520.1
Erbacher, J., Mosher, D. C., Malone, M. J., Berti, D., Bice, K. L., Bostock, H., et al. (2004a). “Site 1258,” in Proc. ODP, Init. Repts. Editors J. Erbacher, D. C. Mosher, and M.J. Malone (College Station, TX: Ocean Drilling Program), 207, 1–117. doi:10.2973/odp.proc.ir.207.105.2004
Erbacher, J., Mosher, D. C., Malone, M. J., Berti, D., Bice, K. L., Bostock, H., et al. (2004b). “Site 1260,” in Proc. ODP, Init. Repts. Editors J. Erbacher, D. C. Mosher, and M. J. Malone (College Station, TX: Ocean Drilling Program), 207, 1–113. doi:10.2973/odp.proc.ir.207.107.2004
Erbacher, J., Friedrich, O., Wilson, P. A., Birch, H., and Mutterlose, J. (2005). Stable Organic Carbon Isotope Stratigraphy across Oceanic Anoxic Event 2 of Demerara Rise, Western Tropical Atlantic. Geochem. Geophys. Geosyst. 6, Q06010. doi:10.1029/2004GC000850
Espitalié, J., Deroo, G., and Marquis, F. (1985a). La pyrolyse Rock-Eval et ses applications. Première partie. Rev. Inst. Fr. Pét. 40, 563–579. doi:10.2516/ogst:1985035
Espitalié, J., Deroo, G., and Marquis, F. (1985b). La pyrolyse Rock-Eval et ses applications. Deuxième partie. Rev. Inst. Fr. Pét. 40, 755–784. doi:10.2516/ogst:1985045
Espitalié, J., Deroo, G., and Marquis, F. (1986). La pyrolyse Rock-Eval et ses applications. Troisième partie. Rev. Inst. Fr. Pét. 41, 73–89. doi:10.2516/ogst:1986003
Forster, A., Schouten, S., Moriya, K., Wilson, P. A., and Sinninghe Damste, S. (2007). Tropical Warming and Intermittent Cooling during the Cenomanian/Turonian Oceanic Anoxic Event 2: Sea Surface Temperature Record from the Equatorial Atlantic. Paleoceanography 22, 1219. doi:10.1029/PA001349
Freeman, K. H., and Hayes, J. M. (1992). Fractionation of Carbon Isotopes by Phytoplankton and Estimates of Ancient CO2 levels. Glob. Biogeochem. Cycles 6 (2), 185–198. doi:10.1029/92gb00190
Friedrich, O., Erbacher, J., and Mutterlose, J. (2006). Paleoenvironmental Changes across the Cenomanian/Turonian Boundary Event (Oceanic Anoxic Event 2) as Indicated by Benthic Foraminifera from the Demerara Rise (ODP Leg 207). Revue de Micropaléontol. 49 (3), 121–139. doi:10.1016/j.revmic.2006.04.003
Fry, B., Jannasch, H. W., Molyneaux, S. J., Wirsen, C. O., Muramoto, J. A., and King, S. (1991). Stable Isotope Studies of the Carbon, Nitrogen and Sulfur Cycles in the Black Sea and the Cariaco Trench. Deep Sea Res. A. Oceanographic Res. Pap. 38, S1003–S1019. doi:10.1016/S0198-0149(10)80021-4
Gale, A. S., and Christensen, W. K. (1996). Occurrence of the Belemnite Actinocamax Plenus in the Cenomanian of SE France and its Significance. bgsd 43 (1), 68–77. doi:10.37570/bgsd-1996-43-08
Gale, A. S., Jenkyns, H. C., Kennedy, W. J., and Corfield, R. M. (1993). Chemostratigraphy versus Biostratigraphy: Data from Around the Cenomanian-Turonian Boundary. J. Geol. Soc., 150, 29–32. doi:10.1144/gsjgs.150.1.0029
Gale, A. S., Jenkyns, H. C., Tsikos, H., van Breugel, Y., Sinninghe Damsté, J. S., Bottini, C., et al. (2019). High-resolution Bio- and Chemostratigraphy of an Expanded Record of Oceanic Anoxic Event 2 (Late Cenomanian-Early Turonian) at Clot Chevalier, Near Barrême, SE France (Vocontian Basin). nos 52 (1), 97–129. doi:10.1127/nos/2018/0445
Goldberg, T., Poulton, S. W., Wagner, T., Kolonic, S. F., and Rehkämper, M. (2016). Molybdenum Drawdown during Cretaceous Oceanic Anoxic Event 2. Earth Planet. Sci. Lett. 440, 81–91. doi:10.1016/j.epsl.2016.02.006
Hay, W. W. (2008). Evolving Ideas about the Cretaceous Climate and Ocean Circulation. Cretaceous Res. 29, 725–753. doi:10.1016/j.cretres.2008.05.025
Herbin, J. P., Montadert, L., Müller, C., Gomez, R., Thurow, J., and Wiedmann, J. (1986). Organic-Rich Sedimentation at the Cenomanian-Turonian Boundary in Oceanic and Coastal Basins in the North Atlantic and Tethys North Atlantic Palaeoceanography. Spec. Publ. Geol. Soc. 21, 389–422. doi:10.1144/GSL.SP.1986.021.01.28
Hetzel, A., Böttcher, M. E., Wortmann, U. G., and Brumsack, H.-J. (2009). Paleo-Redox Conditions during OAE 2 Reflected in Demerara Rise Sediment Geochemistry (ODP Leg 207). Palaeogeogr. Palaeoclimatol. Palaeoecol. 273, 302–328. doi:10.1016/j.palaeo.2008.11.005
Higgins, M. B., Robinson, R. S., Husson, J. M., Carter, S. J., and Pearson, A. (2012). Dominant Eukaryotic Export Production during Ocean Anoxic Events Reflects the Importance of Recycled NH4+. Proc. Natl. Acad. Sci. 109, 2269–2274. doi:10.1073/pnas.1104313109
Holmden, C., Jacobson, A. D., Sageman, B. B., and Hurtgen, M. T. (2016). Response of the Cr Isotope Proxy to Cretaceous Ocean Anoxic Event 2 in a Pelagic Carbonate Succession from the Western Interior Seaway. Geochim. Cosmochim. Acta 186, 277–295. doi:10.1016/j.gca.2016.04.039
Huerta-Diaz, M. A., and Morse, J. W. (1992). Pyritization of Trace Metals in Anoxic Marine Sediments. Geochim. Cosmochim. Acta 56, 2681–2702. doi:10.1016/0016-7037(92)90353-K
Jarvis, I., Lignum, J. S., Gröcke, D. R., Jenkyns, H. C., and Pearce, M. A. (2011). Black Shale Deposition, Atmospheric CO2 drawdown, and Cooling during the Cenomanian-Turonian Oceanic Anoxic Event. Paleoceanography 26 (3), PA3201. doi:10.1029/2010pa002081
Jefferies, R. P. S. (1962). The Paleoecology of the Actinocamax Plenus Subzone (Lowest Turonian) in the Anglo-Paris Basin. Paleontology 4 (4), 609–647.
Jefferies, R. P. S. (1963). The Stratigraphy of the Actinocamax Plenus Subzone (Turonian) in the Anglo-Paris Basin. Proc. Geologists' Assoc. 74, 1–IN4. doi:10.1016/S0016-7878(63)80011-5
Jenkyns, H. C., Gale, A. S., and Corfield, R. M. (1994). Carbon- and Oxygen-Isotope Stratigraphy of the English Chalk and Italian Scaglia and its Palaeoclimatic Significance. Geol. Mag. 131 (01), 1–34. doi:10.1017/s0016756800010451
Jenkyns, H. C., Matthews, A., Tsikos, H., and Erel, Y. (2007). Nitrate Reduction, Sulfate Reduction, and Sedimentary Iron Isotope Evolution during the Cenomanian-Turonian Oceanic Anoxic Event. Paleoceanography 22, PA3208. doi:10.1029/2006PA001355
Jenkyns, H. C., Dickson, A. J., Ruhl, M., and Boorn, S. H. J. M. (2017). Basalt‐seawater Interaction, the Plenus Cold Event, Enhanced Weathering and Geochemical Change: Deconstructing Oceanic Anoxic Event 2 (Cenomanian-Turonian, Late Cretaceous). Sedimentology 64 (1), 16–43. doi:10.1111/sed.12305
Jenkyns, H. C. (2010). Geochemistry of Oceanic Anoxic Events. Geochem. Geophys. Geosyst. 11 (3), Q03004. doi:10.1029/2009GC002788
Jones, C. E., and Jenkyns, H. C. (2001). Seawater Strontium Isotopes, Oceanic Anoxic Events, and Seafloor Hydrothermal Activity in the Jurassic and Cretaceous. Am. J. Sci. 301, 112–149. doi:10.2475/ajs.301.2.112
Jones, B., and Manning, D. A. C. (1994). Comparison of Geochemical Indexes Used for the Interpretation of Palaeoredox Conditions in Ancient Mudstones. Chem. Geol. 111 (1-4), 111–129. doi:10.1016/0009-2541(94)90085-X
Junium, C. K., and Arthur, M. A. (2007). Nitrogen Cycling during the Cretaceous, Cenomanian-Turonian Oceanic Anoxic Event II. Geochem. Geophys. Geosyst. 8, 1–18. doi:10.1029/2006GC001328
Keller, G., Adatte, T., Berner, Z., Chellai, E. H., and Stueben, D. (2008). Oceanic Events and Biotic Effects of the Cenomanian-Turonian Anoxic Event, Tarfaya Basin, Morocco. Cretaceous Res. 29 (5–6), 976–994. doi:10.1016/j.cretres.2008.05.020
Krall, P., Slomp, C. P., Forster, A., and Kuypers, M. M. M. (2010). Phosphorus Cycling from the Margin to Abyssal Depths in the Proto-Atlantic during Oceanic Anoxic Event 2. Palaeogeogr. Palaeodimatol., Palaeoecol. 295, 42–58. doi:10.1016/j.palaeo.2010.05.014
Kuroda, J., Ogawa, N., Tanimizu, M., Coffin, M., Tokuyama, H., Kitazato, H., et al. (2007). Contemporaneous Massive Subaerial Volcanism and Late Cretaceous Oceanic Anoxic Event 2. Earth Planet. Sci. Lett. 256 (1–2), 211–223. doi:10.1016/j.epsl.2007.01.027
Kuypers, M. M. M., Pancost, R. D., and Damsté, J. S. S. (1999). A Large and Abrupt Fall in Atmospheric CO2 Concentration during Cretaceous Times. Nature 399, 342–345. doi:10.1038/20659
Kuypers, M. M. M., Pancost, R. D., Nijenhuis, I. A., and Sinninghe Damsté, J. S. (2002). Enhanced Productivity Led to Increased Organic Carbon Burial in the Euxinic North Atlantic basin during the Late Cenomanian Oceanic Anoxic Event. Paleoceanography 17, 1–13. doi:10.1029/2000PA000569
Kuypers, M. M. M., Lourens, L. J., Rijpstra, W. I. C., Pancost, R. D., Nijenhuis, I. A., and Sinninghe Damsté, J. S. (2004). Orbital Forcing of Organic Carbon Burial in the Proto-North Atlantic during Oceanic Anoxic Event 2. Earth Planet. Sci. Lett. 228, 465–482. doi:10.1130/G20458.110.1016/j.epsl.2004.09.037
Lafargue, E., Marquis, F., and Pillot, D. (1998). Rock-Eval 6 Applications in Hydrocarbon Exploration, Production, and Soil Contamination Studies. Rev. Inst. Fr. Pét. 53, 421–437. doi:10.2516/ogst:1998036
Lancelot, Y., Seibold, E., Cepek, P., Dean, W. E., Eremeev, V., Gardner, J., et al. (1978). “Site 367: Cape Verde Basin,” in Initial Reports of the Deep Sea Drilling Project. 41, 163–232. doi:10.2973/dsdp.proc.41.103.1978
McLennan, S. M. (2001). Relationships between the Trace Element Composition of Sedimentary Rocks and Upper continental Crust. Geochem. Geophys. Geosyst. 2. doi:10.1029/2000GC000109
Mélières, F. (1978). “X-ray Mineralogy Studies, Leg 41, Deep Sea Drilling Project, Eastern North Atlantic Ocean,” in Initial Reports of the Deep Sea Drilling Project, 41. Editor Y. Lancelot (Washington: U. S. Government Printing Office), 1065–1086. doi:10.2973/dsdp.proc.41.142.1978
Monteiro, F. M., Pancost, R. D., Ridgwell, A., and Donnadieu, Y. (2012). Nutrients as the Dominant Control on the Spread of Anoxia and Euxinia across the Cenomanian-Turonian Oceanic Anoxic Event (OAE2): Model-Data Comparison. Paleoceanography 27 (4), PA4209. doi:10.1029/2012pa002351
Naafs, B. D. A., Monteiro, F. M., Pearson, A., Higgins, M. B., Pancost, R. D., and Ridgwell, A. (2019). Fundamentally Different Global marine Nitrogen Cycling in Response to Severe Ocean Deoxygenation. Proc. Natl. Acad. Sci. USA 116 (24), 24979–24984. doi:10.1073/pnas.1905553116
O'Connor, L. K., Jenkyns, H. C., Robinson, S. A., Remmelzwaal, S. R. C., Batenburg, S. J., Parkinson, I. J., et al. (2020). A Re‐Evaluation of the Plenus Cold Event, and the Links between CO 2 , Temperature, and Seawater Chemistry during OAE 2. Paleoceanogr. Paleoclimatol. 35, e2019PA003631. doi:10.1029/2019PA003631
Orth, C. J., Attrep, M., Quintana, L. R., Elder, W. P., Kauffman, E. G., Diner, R., et al. (1993). Elemental Abundance Anomalies in the Late Cenomanian Extinction Interval: A Search for the Source(s). Earth Planet. Sci. Lett. 117 (1–2), 189–204. doi:10.1016/0012-821x(93)90126-t
Ostrander, C. M., Owens, J. D., and Nielsen, S. G. (2017). Constraining the Rate of Oceanic Deoxygenation Leading up to a Cretaceous Oceanic Anoxic Event (OAE-2: ∼94 Ma). Sci. Adv. 3 (8), e1701020. doi:10.1126/sciadv.1701020
Owens, J. D., Lyons, T. W., Li, X., Macleod, K. G., Gordon, G., Kuypers, M. M. M., et al. (2012). Iron Isotope and Trace Metal Records of Iron Cycling in the Proto-North Atlantic during the Cenomanian-Turonian Oceanic Anoxic Event (OAE-2). Paleoceanography 27, PA3223. doi:10.1029/2012PA002328
Owens, J. D., Gill, B. C., Jenkyns, H. C., Bates, S. M., Severmann, S., Kuypers, M. M. M., et al. (2013). Sulfur Isotopes Track the Global Extent and Dynamics of Euxinia during Cretaceous Oceanic Anoxic Event 2. Proc. Natl. Acad. Sci. 110 (46), 18407–18412. doi:10.1073/pnas.1305304110
Pancost, R. D., Crawford, N., Magness, S., Turner, A., Jenkyns, H. C., and Maxwell, J. R. (2004). Further Evidence for the Development of Photic-Zone Euxinic Conditions during Mesozoic Oceanic Anoxic Events. J. Geol. Soc. 161 (3), 353–364. doi:10.1144/0016764903-059
Paul, C. R. C., Lamolda, M. A., Mitchell, S. F., Vaziri, M. R., Gorostidi, A., and Marshall, J. D. (1999). The Cenomanian-Turonian Boundary at Eastbourne (Sussex, UK): a Proposed European Reference Section. Palaeogeogr. Palaeoclimatol. Palaeoecol. 150 (1–2), 83–121. doi:10.1016/s0031-0182(99)00009-7
Pearce, M. A., Jarvis, I., and Tocher, B. A. (2009). The Cenomanian-Turonian Boundary Event, OAE2 and Palaeoenvironmental Change in Epicontinental Seas: New Insights from the Dinocyst and Geochemical Records. Palaeogeogr. Palaeoclimatol. Palaeoecol. 280 (1–2), 207–234. doi:10.1016/j.paleo.2009.06.01210.1016/j.palaeo.2009.06.012
Pogge von Strandmann, P. A. E., Jenkyns, H. C., and Woodfine, R. G. (2013). Lithium Isotope Evidence for Enhanced Weathering during Oceanic Anoxic Event 2. Nat. Geosci 6 (8), 668–672. doi:10.1038/ngeo1875
Poulton, S. W., Henkel, S., März, C., Urquhart, H., Flögel, S., Kasten, S., et al. (2015). A continental-weathering Control on Orbitally Driven Redox-Nutrient Cycling during Cretaceous Oceanic Anoxic Event 2. Geology 43, 963–966. doi:10.1130/G36837.1
Rau, G. H., Arthur, M. A., and Dean, W. E. (1987). 15N/14N Variations in Cretaceous Atlantic Sedimentary Sequences: Implication for Past Changes in marine Nitrogen Biogeochemistry. Earth Planet. Sci. Lett. 82 (3), 269–279. doi:10.1016/0012-821X(87)90201-9
Redfield, A. C. (1958). The Biological Control of Chemical Factors in the Environment. Am. Sci. 46, 205–221.
Ruvalcaba Baroni, I., van Helmond, N. A. G. M., Tsandev, I., Middelburg, J. J., and Slomp, C. P. (2015). The Nitrogen Isotope Composition of Sediments from the Proto-North Atlantic during Oceanic Anoxic Event 2. Paleoceanography 30, 923–937. doi:10.1002/2014PA002744.5
Sageman, B. B., Meyers, S. R., and Arthur, M. A. (2006). Orbital Time Scale and New C-Isotope Record for Cenomanian-Turonian Boundary Stratotype. Geol. 34, 125–128. doi:10.1130/G22074.1
Schlanger, S. O., and Jenkyns, H. C. (1976). Cretaceous Anoxic Events: Causes and Consequences. Geol. Mijnb. 55, 179–184.
Schlanger, S. O., Arthur, M. A., Jenkyns, H. C., and Scholle, P. A. (1987). The Cenomanian-Turonian Oceanic Anoxic Event, I. Stratigraphy and Distribution of Organic Carbon-Rich Beds and the marine δ13C Excursion. Geol. Soc. Lond. Spec. Publications 26 (1), 371–399. doi:10.1144/gsl.sp.1987.026.01.24
Scholle, P. A., and Arthur, M. A. (1980). Carbon Isotope Fluctuations in Cretaceous Pelagic Limestones: Potential Stratigraphic and Petroleum Exploration Tool. Am. Assoc. Pet. Geol. Bull. 60 (1), 67–87. doi:10.1306/2f91892d-16ce-11d7-8645000102c1865d
Schouten, S., Hopmans, E. C., Forster, A., van Breugel, Y., Kuypers, M. M. M., and Sinninghe Damsté, J. S. (2003). Extremely High Sea-Surface Temperatures at Low Latitudes during the Middle Cretaceous as Revealed by Archaeal Membrane Lipids. Geol. 31, 1069–1072. doi:10.1130/G19876.1
Sigman, D. M., Karsh, K. L., and Casciotti, K. L. (2009). “Nitrogen Isotopes in the Ocean,” in Encyclopedia of Ocean Sciences. Editors J.H. Steele, S.A. Thorpe, and K.K. Turekian (Oxford: Academic Press), 40–54. doi:10.1016/b978-012374473-9.00632-9
Sinninghe Damsté, J. S., and Köster, J. (1998). A Euxinic Southern North Atlantic Ocean during the Cenomanian/Turonian Oceanic Anoxic Event. Earth Planet. Sci. Lett. 158, 165–173. doi:10.1016/S0012-821X(98)00052-1
Sinninghe Damsté, J. S. S., Kuypers, M. M. M., Pancost, R. D., and Schouten, S. (2008). The Carbon Isotopic Response of Algae, (Cyano)bacteria, Archaea and Higher Plants to the Late Cenomanian Perturbation of the Global Carbon Cycle: Insights from Biomarkers in Black Shales from the Cape Verde Basin (DSDP Site 367). Org. Geochem. 39, 1703–1718. doi:10.1016/j.orggeochem.2008.01.012
Sinninghe Damsté, J. S., van Bentum, E. C., Reichart, G.-J., Pross, J., and Schouten, S. (2010). A CO2 Decrease-Driven Cooling and Increased Latitudinal Temperature Gradient during the Mid-cretaceous Oceanic Anoxic Event 2. Earth Planet. Sci. Lett. 293 (1–2), 97–103. doi:10.1016/j.epsl.2010.02.027
Sinton, C. W., and Duncan, R. A. (1997). Potential Links between Ocean Plateau Volcanism and Global Ocean Anoxia at the Cenomanian-Turonian Boundary. Econ. Geol. 92, 836–842. doi:10.2113/gsecongeo.92.7-8.836
Snow, L. J., Duncan, R. A., and Bralower, T. J. (2005). Trace Element Abundances in the Rock Canyon Anticline, Pueblo, Colorado, marine Sedimentary Section and Their Relationship to Caribbean Plateau Construction and Oxygen Anoxic Event 2. Paleoceanography 20 (3), PA3005. doi:10.1029/2004pa00109310.1029/2005pa001222
Stüeken, E. E., Kipp, M. A., Koehler, M. C., and Buick, R. (2016). The Evolution of Earth's Biogeochemical Nitrogen Cycle. Earth-Science Rev. 160, 220–239. doi:10.1016/j.earscirev.2016.07.007
Summons, R. E., Jahnke, L. L., Hope, J. M., and Logan, G. A. (1999). 2-Methylhopanoids as Biomarkers for Cyanobacterial Oxygenic Photosynthesis. Nature 400, 554–557. doi:10.1038/23005
Takashima, R., Nishi, H., Hayashi, K., Okada, H., Kawahata, H., Yamanaka, T., et al. (2009). Litho-, Bio- and Chemostratigraphy across the Cenomanian/Turonian Boundary (OAE 2) in the Vocontian Basin of southeastern France. Palaeogeogr. Palaeoclimatol. Palaeoecol. 273, 61–74. doi:10.1016/j.paleo.2008.12.00110.1016/j.palaeo.2008.12.001
Thomazo, C., and Papineau, D. (2013). Biogeochemical Cycling of Nitrogen on the Early Earth. Elements 9, 345–351. doi:10.2113/gselements.9.5.345
Thunell, R. C., Sigman, D. M., Muller-Karger, F., Astor, Y., and Varela, R. (2004). Nitrogen Isotope Dynamics of the Cariaco Basin, Venezuela. Glob. Biogeochem. Cycles 18 (3), GB3001. doi:10.1029/2003GB002185
Topper, R. P. M., Trabucho Alexandre, J., Tuenter, E., and Meijer, P. T. (2011). A Regional Ocean Circulation Model for the Mid-cretaceous North Atlantic Basin: Implications for Black Shale Formation. Clim. Past 7, 277–297. doi:10.5194/cp-7-277-2011
Trabucho Alexandre, J., Tuenter, E., Henstra, G. A., van der Zwan, K. J., van de Wal, R. S. W., Dijkstra, H. A., et al. (2010). The Mid-cretaceous North Atlantic Nutrient Trap: Black Shales and OAEs. Paleoceanography 25, PA4201. doi:10.1029/2010PA001925
Tribovillard, N., Algeo, T. J., Lyons, T., and Riboulleau, A. (2006). Trace Metals as Paleoredox and Paleoproductivity Proxies: An Update. Chem. Geology 232, 12–32. doi:10.1016/j.chemgeo.2006.02.012
Tribovillard, N., Algeo, T. J., Baudin, F., and Riboulleau, A. (2012). Analysis of marine Environmental Conditions Based Onmolybdenum-Uranium Covariation-Applications to Mesozoic Paleoceanography. Chem. Geology 324-325, 46–58. doi:10.1016/j.chemgeo.2011.09.009
Tsikos, H., Jenkyns, H. C., Walsworth-Bell, B., Petrizzo, M. R., Forster, A., Kolonic, S., et al. (2004). Carbon-isotope Stratigraphy Recorded by the Cenomanian-Turonian Oceanic Anoxic Event: Correlation and Implications Based on Three Key Localities. J. Geol. Soc. 161 (4), 711–719. doi:10.1144/0016-764903-077
Tucholke, B. E., Sibuet, J.-C., Klaus, A., Arnaoldi, M., Delius, H., Engström, A. V., et al. (2004). “Site 1276,”. Proc. ODP, Init. Repts. Editors B.E. Tucholke, J.-C. Sibuet, and A. Klaus (College Station, TX: Ocean Drilling Program), 210, 1–358. doi:10.2973/odp.proc.ir.210.103.2004
Turgeon, S. C., and Creaser, R. A. (2008). Cretaceous Oceanic Anoxic Event 2 Triggered by a Massive Magmatic Episode. Nature 454 (7202), 323–326. doi:10.1038/nature07076
Tyrrell, T. (1999). The Relative Influences of Nitrogen and Phosphorus on Oceanic Primary Production. Nature 400, 525–531. doi:10.1038/22941
van Bentum, E. C., Reichart, G.-J., Forster, A., and Sinninghe Damsté, J. S. (2012). Latitudinal Differences in the Amplitude of the OAE-2 Carbon Isotopic Excursion: pCO2 and Paleo Productivity. Biogeosciences 9 (2), 717–731. doi:10.5194/bg-9-717-2012
Van Capellen, P., and Ingall, E. D. (1994). Benthic Phosphorus Regeneration, Net Primary Production, and Ocean Anoxia: a Model of the Coupled marine Biogeochemical Cycles of Carbon and Phosphorus. Paleoceanography 9, 677–692. doi:10.1029/94PA01455
van Helmond, N. A. G. M., Ruvalcaba Baroni, I., Sluijs, A., Sinninghe Damsté, J. S., and Slomp, C. P. (2014a). Spatial Extent and Degree of Oxygen Depletion in the Deep Proto-North Atlantic basin during Oceanic Anoxic Event 2. Geochem. Geophys. Geosyst. 15 (11), 4254–4266. doi:10.1002/2014GC005528
van Helmond, N. A. G. M., Sluijs, A., Reichart, G.-J., Sinninghe Damsté, J. S., Slomp, C. P., and Brinkhuis, H. (2014b). A Perturbed Hydrological Cycle during Oceanic Anoxic Event 2. Geology 42, 123–126. doi:10.1130/G34929.1
van Hinte, J. E., Wise, S. W., Biart, B. N. M., Covington, J. M., Dunn, D. A., Haggerty, J. A., et al. (1993). “Site 603,”. Proc. DSDP, Init. Repts. Editors J. E. van Hinte, and S. W. WiseJr. (College Station, TX: Ocean Drilling Program), 93, 25–276. doi:10.2973/dsdp.proc.93.102.1987
Wedepohl, K. H. (1971). “Environmental Influences on the Chemicalcomposition of Shales and Clays,” in Physics and Chemistry of theEarth. Editors L.H. Ahrens, F. Press, S.K. Runcorn, and H.C. Urey (Oxford: Pergamon), 305–333.
Westermann, S., Vance, D., Cameron, V., Archer, C., and Robinson, S. A. (2014). Heterogeneous Oxygenation States in the Atlantic and Tethys Oceans during Oceanic Anoxic Event 2. Earth Planet. Sci. Lett. 404, 178–189. doi:10.1016/j.epsl.2014.07.018
Zhang, X., Sigman, D. M., Morel, F. M. M., and Kraepiel, A. M. L. (2014). Nitrogen Isotope Fractionation by Alternative Nitrogenases and Past Ocean Anoxia. Proc. Natl. Acad. Sci. USA 111, 4782–4787. doi:10.1073/pnas.1402976111
Zheng, X.-Y., Jenkyns, H. C., Gale, A. S., Ward, D. J., and Henderson, G. M. (2013). Changing Ocean Circulation and Hydrothermal Inputs during Ocean Anoxic Event 2 (Cenomanian-Turonian): Evidence from Nd-Isotopes in the European Shelf Sea. Earth Planet. Sci. Lett. 375, 338–348. doi:10.1016/j.epsl.2013.05.053
Keywords: cenomanian, turonian, carbon and nitrogen, trace metal elements, chemocline, reoxygenation
Citation: Riquier L, Cadeau P, Danzelle J, Baudin F, Pucéat E and Thomazo C (2021) The Plenus Cold Event Record in the Abyssal DSDP Site 367 (Cape Verde, Central Atlantic): Environmental Perturbations and Impacts on the Nitrogen Cycle. Front. Earth Sci. 9:703282. doi: 10.3389/feart.2021.703282
Received: 30 April 2021; Accepted: 19 July 2021;
Published: 13 August 2021.
Edited by:
Eva Stüeken, University of St Andrews, United KingdomReviewed by:
Jean-Carlos Montero-Serrano, Université du Québec à Rimouski, CanadaXin-Yuan Zheng, University of Minnesota Twin Cities, United States
Copyright © 2021 Riquier, Cadeau, Danzelle, Baudin, Pucéat and Thomazo. This is an open-access article distributed under the terms of the Creative Commons Attribution License (CC BY). The use, distribution or reproduction in other forums is permitted, provided the original author(s) and the copyright owner(s) are credited and that the original publication in this journal is cited, in accordance with accepted academic practice. No use, distribution or reproduction is permitted which does not comply with these terms.
*Correspondence: Laurent Riquier, laurent.riquier@sorbonne-universite.fr