

Abstract
We present high spatial-resolution trends of the Palmer drought severity index (PDSI), potential evapotranspiration (PET), and selected climate variables from 1979–2013 for the contiguous United States in order to gain an understanding of recent drought trends and their climatic forcings. Based on a spatial grouping analysis, four regions of increasing (upper Midwest, Louisiana, southeastern United States (US), and western US) and decreasing (New England, Pacific Northwest, upper Great Plains, and Ohio River Valley) drought trends based on Mann–Kendall Z values were found. Within these regions, partial correlation and multiple regression for trends in climate variables and PDSI were performed to examine potential climatic controls on these droughts. As expected, there was a US-wide concurrence on drought forcing by precipitation. However, there was correspondence of recent PET trends with recent drought trends in many regions. For regions with an increase in recent droughts, average air temperature was generally the second most important variable after precipitation in determining recent drought trends. Across the regions where recent drought trends are decreasing, there was no clear ranking of climate-variable importance, where trends in average temperature, specific humidity and net radiation all played significant regional roles in determining recent drought trends. Deconstructing the trends in drought show that, while there are regions in the US showing positive and negative trends in drought conditions, the climate forcings for these drought trends are regionally specific. The results of this study allow for the interpretation of the role of the changing hydroclimatic cycle in recent drought trends, which also have implications for the current and impending results of climate change.
Export citation and abstract BibTeX RIS

Content from this work may be used under the terms of the Creative Commons Attribution 3.0 licence. Any further distribution of this work must maintain attribution to the author(s) and the title of the work, journal citation and DOI.
1. Introduction
Droughts affect every region of the United States (US) and can have a significant impact on human and natural systems. For example, in 2012 over 50% of the contiguous US experienced moderate to severe drought conditions (Miskus 2013), and about 80% of agricultural land experienced moderate drought conditions (USDA 2013). As of 2015, the current drought in California is one of the worst in recorded history (Griffin and Anchukaitis 2014). This drought, and many previous US droughts (e.g., 1930s, 1950–1956, 1987–1989), highlight the vulnerability of the US and the need to better understand the spatiotemporal variability of drought.
While the general definition of drought—a deficit of precipitation—is well known, quantifying drought is more difficult. The challenges result from the diversity of questions one can ask about drought leading to differences in the classification of drought over varying timespans, and the influence of drought on a variety of socioeconomic factors. A number of drought indices exist in an attempt to quantify drought conditions, allowing the comparison of regions with different climates (Heim 2002). Many of these indices, however, have drawbacks. While some are simple and can represent broad patterns of soil moisture, they fail to accurately represent soil moisture for specific regions (e.g., standardized precipitation index; McKee et al 1993, Palmer drought severity index (PDSI); Palmer 1965). Other indices have been found to be accurate when applied in a certain environment or region but are not able to represent broad scale drought (e.g., surface water supply index; Wilhite and Glantz 1985, Doesken et al 1991, Garen 1993) throughout the US (Heim 2002). The specific definition of drought severity, therefore, ultimately varies depending on the timescale, spatial area, and the purpose of the study.
Further complexities arise when examining trends in drought conditions. Initially, global drought conditions were shown to be increasing since 1950 (Vicente-Serrano et al 2010, Dai 2011a, 2011b, 2013). However, recent studies have argued the increasing trend is an artifact of the method used to estimate potential evapotranspiration (PET) rather than a true trend (Sheffield et al 2012). In the US, there is more confidence in estimating trends by examining long-term precipitation records. For example, it has been shown that most of the eastern US has been getting wetter (Groisman et al 2004, Andreadis and Lettenmaier 2006). The pluvial has been extensively documented in the northeastern US using both instrumental and proxy records (Horton et al 2011, Pederson et al 2012, Seager et al 2012). Recent studies have shown that the southeastern US has been experiencing an intensification of variability in summer precipitation (Li et al 2010, Li et al 2013). Many studies have compared the ongoing drought in the western US to past megadroughts that were more severe and longer-lasting (Cook et al 2007, Cook et al 2010, Cook et al 2014) to determine if the current drought might persist or intensify. When examining trends in US drought conditions, many studies have examined synoptic- to global-scale teleconnections as the leading causes (e.g., the North Atlantic sub-tropical high or El Niño Southern oscillation). However, no studies have deconstructed the climatic forcings that are driving these drought trends, and consequently the role of recent changes in climate forcings on drought are not well understood (Trenberth et al 2014). This has resulted in debates on the recent trends in droughts throughout the world (Vicente-Serrano et al 2010, van der Schrier et al 2011, 2013, Seneviratne 2012, Sheffield et al 2012, Dai 2013) and highlights the need to better understand the climatic drivers behind droughts and examine inter-regional differences.
An increase in air temperature is expected to increase the vapor pressure deficit resulting in an increase in evaporative demand in the air, leading to increases in drought frequency and severity (Dai 2011b). Recent studies have found contradictory results in worldwide drought severity (Sheffield et al 2012, Dai 2013), which were based on low-resolution climate data. Other climatic variables (precipitation, wind, solar radiation, etc) are subject to great uncertainty at the global scale and thus conclusions may be highly variable. Thus, making use of available high spatial resolution climate and drought data provides an opportunity to assess high-resolution trends and the reasons for these trends. The objectives of this work, then, are to (1) identify and quantify high spatial resolution trends in recent (1979–2013) droughts in the US; (2) identify regions of similar drought trends; and (3) determine the deconstructed climatic forcings responsible for these trends at the regional level. Studies have shown that increases in air temperature, beyond one standard deviation of year-to-year variability, have occurred since 1980 (Lobell et al 2011); therefore this study captures the recent changes in drought and individual climate variables brought on by recent climate change.
2. Materials and methods
2.1. PDSI and Penman–Monteith PET
We used the PDSI (Palmer 1965) to quantify and define drought. The PDSI is an index based on a water-balance that characterizes the cumulative departure of surface-moisture supply and demand based on local mean conditions (Palmer 1965). The PDSI requires common climate variables allowing the computation of soil-moisture conditions through time at a wide range of locations. Further, many US federal and state agencies use PDSI in their water management plans (Werick et al 1994). The PDSI has several limitations (see Alley 1984, Karl and Knight 1985, Werick et al 1994). For example, snowmelt is not included, and drought-intensity classifications (e.g., 'severe' drought) are based on those definitions in central Iowa and western Kansas, and thus the intensity classification is not necessarily comparable to other regions.
Recent improvements to the PDSI address some of these problems. By replacing the empirical constants to calibration coefficients in the PDSI calculation, the self-calibrated PDSI (scPDSI) (Wells et al 2004) allows for drought intensities and spatial patterns of drought from different regions to be more comparable. However, for this study we are examining trends in drought conditions and the climate forcings of these trends and are not comparing drought intensities from different locations, and therefore many of these limitations do not apply. When a trend is present in the data, the scPDSI calibrated parameters can exaggerate or diminish the trend (Sheffield et al 2012—supplemental material). Sheffield et al (2012) found that globally scPDSI exaggerated the trend while dampening the variability of the signal in global drought. Based on the work by Sheffield et al (2012), the original PDSI calculation has been found to perform better when assessing drought trends. Additionally, similar to Sheffield et al (2012) we found that nearly all the grid points were significantly correlated between PDSI and a lower-resolution scPDSI dataset calculated from Dai (2011a, 2011b), with an average correlation of 0.73 and standard deviation of 0.11. We also tested the distributions between our PDSI and Dai's scPDSI (2011) using a two-sided t-test and found that only 8% of the 53 783 grid points were significantly different.
The Thornthwaite temperature-based method for estimating PET in PDSI has been criticized for potentially overestimating drought conditions for future projections (Vicente-Serrano et al 2010, Hoerling et al 2011, Sheffield et al 2012). The Thornthwaite method uses a linear rescaling of temperature to estimate PET and thus can overestimate dryness and PET when temperatures exceed the calibration period baseline. The critiques of the Thornthwaite method have generally been directed at studies examining global soil-moisture conditions (e.g., Sheffield et al 2012). To overcome this problem, many studies suggest using the physically-based Penman–Monteith method for estimating PET (Hoerling et al 2011, Sheffield et al 2012, Dai 2013), and therefore we use the Penman–Monteith PET method for this work. The Penman–Monteith method used here is the United Nations Food and Agriculture Organization (FAO; Allen et al 1998) method.
2.2. Climate data set
Climate data including minimum/maximum air temperature, precipitation, downward solar radiation, wind speed, and specific humidity for the years 1979–2013 were extracted from the University of Idaho Gridded Surface Meteorological Data (METDATA; Abatzoglou 2013), which is available in a netCDF format for the contiguous US at http://metdata.northwestknowledge.net/. METDATA is a hybrid of parameter-elevation regressions on independent slopes (PRISM; Daly et al 2008) and the North American Land Data Assimilation System—Phase 2 (NLDAS-2; Mitchell et al 2004). Data from the NLDAS-2 are primarily derived from the North American Regional Reanalysis (NARR; Mesinger et al 2006). Minimum/maximum air temperature, precipitation, downward solar radiation, wind speed, and specific humidity were extracted due to their direct role in drought estimation. The original 3 km scale METDATA data were resampled to 12 km for aid in computation, resulting in a unique combination of 53 783 latitude and longitudes covering the entire contiguous US. Downward solar radiation (W m–2) from METDATA was converted to net radiation (MJ m–2) using latitude and longitude (to calculate the solar declination angle for the day or month to be calculated and Earth–Sun distance), clear sky and terrestrial radiation, temperature, vapor pressure, and albedo. Average annual albedo from Barkstrom (1984) was used to estimate net radiation, and elevation data from the US Geological Survey were used to estimate atmospheric pressure.
2.3. PDSI tool
A PDSI calculation tool that uses Penman–Monteith PET was previously developed within Matlab for this work. Climatic data from METDATA (see section 2.2) were used as inputs to the PDSI tool. Our work indicates that the PDSI tool used in this work accurately estimates PDSI using the Penman–Monteith PET approach compared to a coarser resolution PDSI dataset developed by Dai (2011a, 2011b) with an average correlation of 0.73 from 1979–2012
2.4. Statistical analyses
PDSI has been determined to have a memory lag of approximately 12–18 months (Guttman 1998, Cook et al 1999, Vicente-Serrano et al 2010), and thus we employed a post-processing step of applying a moving average of the preceding 12 months on the Penman–Monteith PET and climatic variables to build the memory structure into the forcing variable datasets. The moving average was only performed to investigate relationships and conduct statistical analyses and not on the climate forcings used to calculate PDSI. The climate forcing variables used to calculate PDSI were observed, non-smoothed climate data. All statistical analyses were conducted on these moving averaged datasets and the original non-lagged PDSI data.
The Mann–Kendall non-parametric trend test (Mann 1945, Kendall 1975) was used to determine trends from 1979–2013 for PDSI and Penman–Monteith PET. In addition, trends were also calculated for climate variables that affect drought either directly through precipitation or indirectly through PET (average air temperature, precipitation, wind speed, net radiation, and specific humidity). Positive and negative values of Z indicate an increasing and decreasing trend, respectively. Testing whether the trend is significant at the α-level can be done by comparing Z to the Z1-α/2 value obtained from the standard normal cumulative distribution tables (Modarres and de Paulo Rodrigues da Silva 2007). Statistical significance was determined at p ≤ 0.05. Additionally, while we do not quantify the rate of trend for this study, the magnitude of Z is a proxy for the trend intensity. The Mann–Kendall test has been frequently used in trend analyses in the recent literature (Yue et al 2002, Tabari et al 2011, Gocic and Trajkovic 2013).
Prewhitening, a procedure to eliminate the effect of serial correlation in trend analyses, was not performed on the time series in this study. Several studies have discussed the advantages and disadvantages of prewhitening time series (Yue et al 2002, Yue et al 2003, Bayazit and Önöz 2004, Zhang and Zwiers 2004). Ultimately, a review of prewhitening by Bayazit and Önöz (2007) provides recommendations of when and when not to prewhiten. Their final recommendation is that prewhitening is not needed for large sample sizes (n ≥ 50) and high slopes of trend (b ≥ 0.01), both of which are true for this study (see results for discussion of Mann–Kendall Z trends).
To aid in interpretation and allow regional comparisons, regions of significantly high (increase in PDSI; decrease in drought) and low (decrease in PDSI; increase in drought) Mann–Kendall Z values were identified using the Getis-Ord Gi* statistic (Getis and Ord 1992). The Getis-Ord Gi* statistic identifies statistically significant regions (or latitudes/longitudes for this work) with values higher or lower than would occur by random chance (p ≤ 0.05 for this study). The regions identified from the Getis-Ord Gi* statistic were extracted from the entire US dataset, and statistical analyses were then performed on these regions individually to tease out potential climatic drivers for these droughts. Pearson partial correlations and multiple–regression beta coefficients between the Mann–Kendall Z values of climate variables (precipitation, average air temperature, precipitation, wind speed, net radiation, and specific humidity) and PDSI were then performed for the grid points in each region to determine the dominant controls on recent trends in droughts. Partial correlations allow for the assessment of the relationship between Mann–Kendall Z and a climate variable, with the effects of the other climate variables removed. The multiple regression analysis output is used to rank and determine the effect of the changing climate variables via regression coefficients on PDSI trends. The multiple regression correlation coefficients were corrected for spatial autocorrelation using the generalized least squares method.
3. Results and discussion
3.1. Mann–Kendall Z results for drought and PET
Figure 1 displays Mann–Kendall Z statistics at 12 km spacing (53 783 latitude/longitude combinations) for the contiguous US with the significance represented by hatched lines. Nearly the entire western and southern US has a significantly decreasing trend in PDSI values, which indicates that drought is increasing from 1979–2013 in these areas. Mann–Kendall Z statistics also indicate that drought is increasing in nearly all of the upper Midwest (Wisconsin and Michigan). Conversely, there are also regions in the US where drought is significantly decreasing, most notably the upper Great Plains, northeastern US, northeastern Kentucky/southeastern Indiana/southern Ohio, and a small portion of the Pacific Northwest.
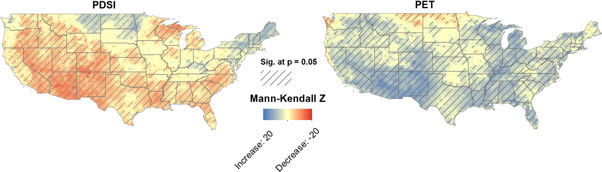
Figure 1. Recent trends in the Palmer drought severity index (PDSI) and Penman–Monteith potential evapotranspiration (PET) in the United States as identified by the Mann–Kendall Z statistic. A positive Mann–Kendall Z value shows an increasing trend, while a negative Mann–Kendall Z shows a decreasing trend. A decreasing trend in PDSI values, therefore, denotes an increasing trend in drought conditions.
Download figure:
Standard image High-resolution imageIn agreement with other studies (Brutsaert and Parlange 1998, Brutsaert 2006, Sheffield et al 2012, Vincente-Serrano et al 2014), we find that Penman–Monteith PET is increasing from 1979–2013 for nearly all of the US, implying that evaporative demand is increasing. Spatial and temporal changes in PET are driven by the average temperature rise and changes of other factors that determine the radiative (i.e., solar radiation) and aerodynamic components (i.e., air temperature, relative humidity and wind speed) (e.g., McVicar et al 2012) of the Penman–Monteith PET equation. The increase in PET is especially noticeable in the southwestern US (Arizona, Colorado, and New Mexico) with an average Mann–Kendall Z of 8.3. The upper Great Plains (eastern Montana, much of North Dakota, and northern Minnesota) is the only major region in the US where PET is significantly decreasing.
3.2. Getis-Ord Gi* statistic results and region delineation
Based on the Getis-Ord Gi* analysis, there are several areas in the US where statistically significant regions of increasing or decreasing drought appear, and can therefore be aggregated to compare the climatic forcings of drought trends for different regions (figure 2). The regions of increasing drought are the western US (average PDSI Mann–Kendall Z of −6.4), upper Midwest (−6.4), Louisiana region (−5.8), and the southeastern US (−5.3). The regions of decreasing drought are the Pacific Northwest (1.8), Ohio River Valley (3.3), upper Great Plains (4.7), and New England (4.8). As previously mentioned, PDSI and climate trend data for the grid points in each region were isolated, and statistical analyses were performed on these regions separately.
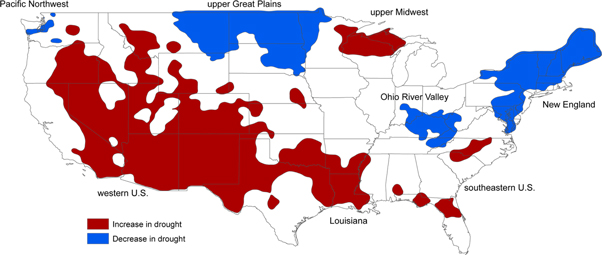
Figure 2. Regions of similarly increasing or decreasing drought trends as identified by the Getis-Ord Gi* analysis, which identifies statistically significant clusters of similar Mann–Kendall Z values.
Download figure:
Standard image High-resolution imageSome of the trends in drought conditions in these regions have been well documented, such as the western US (Cook et al 2004, MacDonald et al 2008, Weiss et al 2009), New England (Horton et al 2011, Pederson et al 2012, Seager et al 2012;), and the southeastern US (Li et al 2010, Li et al 2013). However, to our knowledge, the upper Great Plains, Pacific Northwest, and the Ohio River Valley regions of decreasing drought and the upper Midwest increasing drought have not been documented elsewhere in detail. Dorigo et al (2012) discuss trends in soil moisture for the entire globe for the period 1988–2010 and find similar trends for these regions, albeit at a much different spatial scale. Andreadis and Lettenmaier (2006) evaluated drought trends for the entire 20th century, and their results concur with this study for the western US, southeastern US, Pacific Northwest, New England, and Ohio River Valley. In this study, several other regions, such as the upper Midwest and Louisiana, show opposing trends to those found by Andreadis and Lettenmaier (2006), suggesting that drought in these regions has increased since 1979, compared to the overall 20th century trend. It must be noted that it is extremely difficult to compare trends over different time periods (i.e., entire 20th century versus late 20th century), and even more difficult to compare trends of different climate variables or drought metrics (i.e., drought duration, drought severity, soil moisture anomalies, etc).
3.3. Climatic deconstruction of recent drought trends
As expected, PDSI and PET are significantly negatively correlated (average pairwise correlation of −0.68), as higher PET will result in drier conditions (lower PDSI values). The recent changes in drought are significantly positively correlated to recent changes in precipitation (table 1), which is further validated by the regression analyses with an average regression coefficient of 0.60 (table 2). Precipitation is the dominant climate variable in determining all drought trends (increasing or decreasing) for all regions (table 2). Overall, the regions of increasing drought have a slightly lower partial correlation to precipitation (upper Midwest: 0.52, southeastern US: 0.53; Louisiana: 0.52; western US: 0.65) than the regions of decreasing drought (New England: 0.74; Ohio River Valley: 0.75; upper Great Plains: 0.78; Pacific Northwest: 0.74); however, precipitation is still a large driver in determining recent droughts for these regions. The spatial patterns show correspondence of precipitation to increasing or decreasing drought trends (figure 3).
Table 1. Partial correlations between 12-month moving-averaged climate variables and the Palmer drought severity index grouped by regions of similar drought trends for 1979–2013.
| Upper Midwest | Southeastern US | Louisiana | Western US | |
|---|---|---|---|---|
| Increase in drought | ||||
| Average temperature | −0.31 | −0.44 | −0.43 | −0.45 |
| Precipitation | 0.52 | 0.53 | 0.52 | 0.65 |
| Wind | −0.28 | −0.10 | −0.01a | 0.09 |
| Net radiation | −0.06 | −0.22 | 0.08 | −0.18 |
| Specific humidity | 0.14 | 0.31 | 0.28 | 0.18 |
| New England | Ohio River Valley | Upper Great Plains | Pacific Northwest | |
| Decrease in drought | ||||
| Average temperature | −0.29 | −0.31 | −0.15 | −0.50 |
| Precipitation | 0.74 | 0.75 | 0.78 | 0.74 |
| Wind | −0.55 | −0.38 | −0.09 | 0.24 |
| Net radiation | 0.28 | 0.22 | 0.13 | 0.05a |
| Specific humidity | 0.19 | 0.34 | 0.41 | 0.37 |
Table 2. Multiple regression coefficients for post-processed 12-month moving average climate variables (independent variables) and the Palmer drought severity index (dependent variable) grouped by regions of similar drought trends for 1979–2013. Regression coefficients were corrected for spatial autocorrelation using the generalized least squares method.
| Upper Midwest | Southeastern US | Louisiana | Western US | |
|---|---|---|---|---|
| Increase in drought | ||||
| Average temperature | −0.39 | −0.16 | −0.16 | −0.20 |
| Precipitation | 0.59 | 0.53 | 0.49 | 0.61 |
| Wind | −0.25 | −0.08 | 0.05 | −0.05 |
| Net radiation | −0.09a | −0.14 | 0.06 | −0.04 |
| Specific humidity | 0.13 | 0.12 | 0.14 | 0.01 |
| New England | Ohio River Valley | Upper Great Plains | Pacific Northwest | |
| Decrease in drought | ||||
| Average temperature | −0.26 | −0.23 | −0.18 | −0.18 |
| Precipitation | 0.75 | 0.74 | 0.81 | 0.91 |
| Wind | −0.13 | −0.20 | −0.02a | 0.10a |
| Net radiation | 0.16 | 0.17 | 0.03 | 0.06a |
| Specific humidity | 0.10 | 0.09 | 0.20 | 0.13 |
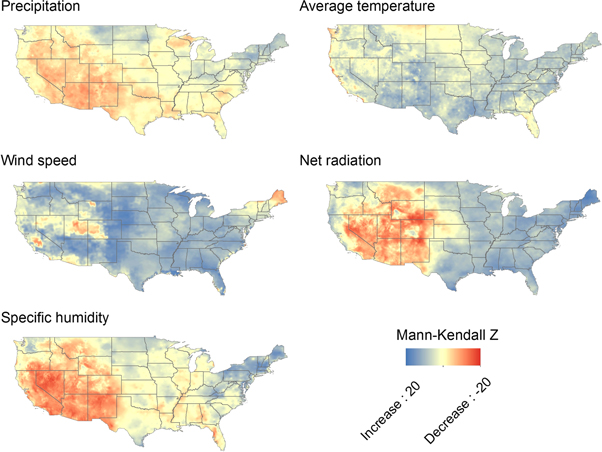
Figure 3. Mann–Kendall Z maps of climate variables used to assess recent trends in drought. A positive Mann–Kendall Z value shows an increasing trend, while a negative Mann–Kendall Z shows a decreasing trend.
Download figure:
Standard image High-resolution image
Although recent drought trends have mainly been controlled by precipitation, these trends have been exacerbated or alleviated by changes in evaporative demand, varying from region-to-region. This can be seen in table 2, where the beta coefficient for precipitation, on average, can only explain 56% of the recent drought trend variation of areas of increasing drought, but 80% of areas of decreasing drought. An increase in average air temperature over time results in a PET increase, leading to increases in drought (decreases in PDSI values). Based on Mann–Kendall Z, average temperature is increasing throughout a major portion of US, which is corroborated by several other studies (IPCC 2007, Lobell et al 2011).
It is clear in the partial correlations (table 1) that some regional drought trends are more affected by the increasing air temperature trends than others. Drought trends for all regions are significantly correlated to air temperature, with an overall average partial correlation of −0.36 (increasing air temperature, decreasing PDSI). Examination of the regression results further validate that recent trends in average temperature are a large component of the recent increasing trends in drought (table 2), where average air temperature is the second ranked climate variable for the upper Midwest, southeastern US, western US, New England, and the Pacific Northwest in determining the recent drought trends. Surprisingly, trends in average temperature for the Ohio River Valley and upper Great Plains—also undergoing decreasing drought—are lower in the list, being the fourth and third ranked climate variables, respectively (table 2).
Changes in wind also affect drought through increases in water-vapor transpiration. However, estimation of wind speed is a largely uncertain process, and a study by Pryor et al (2009) found different wind-speed trends based on observational and reanalysis datasets. Our results indicate that wind speed has increased for nearly all of the US except for a few areas in the western US and New England (figure 3), which was also shown by Holt and Wang (2012). However, Holt and Wang (2012) did not find a statistically significant trend for the northeastern portion of the US. An analysis of wind-speed trends by Pryor et al (2009) did not find the same level of significance in the increasing trend of wind for the NARR dataset, the same dataset from which our speeds are derived. However, Pryor et al (2009) only assessed the 50th and 90th percentile of trends. As previously mentioned, the wind speed assessed in this study is a 12-month moving average for comparison to PDSI, so discrepancies may result from the smoothing of the data.
While wind speeds are decreasing in the western US and New England, these regions have differing recent drought trends, with New England experiencing decreasing drought conditions, while drought conditions are increasing in the western US. For the western US, recent changes in drought are significantly, but weakly-to-moderately correlated (0.09) to the recent changes in wind speed (table 1). The changes in wind speed in New England, on the other hand, are significantly and strongly negatively correlated (−0.55) to changes in PDSI (increased wetting conditions). One can assume that the recent decrease in wind is affecting the recent decrease in droughts in the New England portion of the US; however, there are regions (southeastern US, upper Great Plains, and western US) where trends in wind have a small correlation to recent drought trends (table 1), further validated by the regression results (table 2). Attributing a cause to trends in wind-speed is difficult due the complex nature of influencing factors on wind, ranging from global or hemispheric to regional or local scales (Klink 1999). Additionally, recent studies (Vecchi and Soden 2007, Cheng et al 2013) suggest that wind speed is projected to continue to increase in the 21st century, while other studies (Nikulin et al 2011, Pryor et al 2012) do not anticipate a significant change in wind speed.
Changes in net radiation also have a role in recent drought trends. Net radiation is strongly decreasing in the western US, especially at higher elevations (figure 3). This is in agreement with recent solar radiation trends found by Hobbins et al (2004). Intuitively, decreases in net radiation contribute to decreases in drought. However, that is not the case for the western US. The correlation between recent net radiation and PDSI trends in the western US is −0.18, a significant, but weak-to-moderate correlation (table 1). From the regression results for the western US, net radiation is ranked the fourth most influential climate variable, behind precipitation, average temperature, and wind speed (table 2). Recent trends in specific humidity, and thus relative humidity, are also decreasing for the western US, and are correlated to increasing drought conditions. The strong control of specific humidity (discussed below; table 1) on drought in the western US is a likely explanation for the relationship of decreasing net radiation to increasing drought trends, as the calculation of net radiation (the terrestrial component) relies on humidity and vapor pressure. However, there are several regions in the US where moderate significant correlations between recent drought and net radiation trends exist (table 1).
Specific humidity regulates evaporation and transpiration processes and is therefore highly connected to surface hydrology. On average, the partial correlation between specific humidity and drought trends is 0.28 (table 1). Regions of decreasing drought have a higher partial correlation (0.33) than regions with increasing drought (0.23), suggesting that areas of decreasing drought (increasing PDSI) are also regions where specific humidity is increasing. For the regression results, specific humidity is a large component of the recent decreasing drought trends only in the upper Great Plains, ranking only behind precipitation (table 2). As for regions of increasing drought, trends in specific humidity in Louisiana and the western US have the strongest partial correlations to recent drought trends with values of 0.28 and 0.18, respectively.
Water vapor in the atmosphere is expected to increase under conditions of greenhouse-gas induced warming (IPCC 2007). We show increasing trends (some minor) for specific humidity throughout the US (figure 3), except for the western and southwestern US, which was also found by Willett et al (2007) and Gaffen and Ross (1999). The recent trends in specific humidity are highly correlated to recent changes in precipitation (figure 3), as an increase in water vapor content in the air will also lead to increases in precipitation (Gaffen and Ross 1999, Willett et al 2007). This positive relationship emphasizes the role of specific humidity on recent drought trends as found in Willett et al (2007).
4. Conclusions
The results of this study allow for the interpretation of the role of the changing hydroclimatic cycle in changes to recent drought trends in the US, which have implications for the current and impending results of climate change. To this end, we present trends in drought, PET, and selected climate variables from 1979–2013 for the contiguous US in order to gain an understanding of the potential relationships to recent drought trends.
While trends in droughts and other climate variables have been previously assessed, especially in the context of climate change, a combination of the two has not to our knowledge been assessed. Much of the recent trends and climate deconstruction work has been performed on PET, or the PET balance with precipitation, resulting in changes in aridity (Seager et al 2007, Kingston et al 2009, Feng and Fu 2013, Fu and Feng 2014, Scheff and Frierson 2014, Sherwood and Fu 2014). These studies concur that PET is increasing and is expected to increase throughout the world, and when coupled with changes in precipitation, will affect long-term changes in aridity. However, our current work examines changes in climate (and therefore PET) and its relationship to drought, which is a measure that is sensitive to dry soil moisture extremes, compared to aridity, which measures long-term shifts in average moisture conditions. Scheff and Frierson (2014) conducted a detailed sensitivity analysis of the response and scaling of PET given the behavior of associated climate variables from general circulation model (GCM) output. While their work highlights how projected changes in climate variables can affect PET, our study, in contrast, tries to elucidate how recent, observed trends in climate variables are related to recent trends in drought, which also involves examining trends in precipitation. Additionally, while Scheff and Frierson (2014) state that temperature is the main driver of global PET, our results suggest that, while temperature is an important driver, other climate variables such as wind, solar radiation, and specific humidity can also play regionally important roles in changes in PET and hence drought. Using GCM projections, Fu and Feng (2014) also show that expansion of arid climates is expected. However, while extremely important, Fu and Feng (2014) do not conduct a regional analysis and only focus on the global scale. Fu and and Feng (2014) found that in addition to temperature, global relative humidity had a strong influence on the dryness of the terrestrial climate, while wind speed and available energy contributed little. While these studies highlight how recent and future changes in global aridity may occur based on the balance of precipitation and PET, our work examines regional observed changes in drought, which, in comparison to background aridity, is much less well understood.
The Intergovernmental Panel on Climate Change (IPCC) Assessment Report (AR) 5 stated that the recent trends in drought were 'probably overstated' in AR4, which indicated that global droughts have increased from 1900 to 2002 (with a higher increase since 1979) based on the work of Dai et al (2004). However, recent work by Sheffield et al (2012) show little change in recent global drought trends. These disparate results are further discussed in Trenberth et al (2014). Our work shows that neither statement is false, and that drought is an extremely regionally-specific phenomenon and should perhaps only be examined at the regional scale. Deconstructing the trends in drought show that while regions in the US are showing positive and negative trends in drought conditions; the climate forcings for these trends are regionally specific. Analyzing the specific forcings driving the trends in drought conditions allows for a better understanding of ongoing drought trends and can be beneficial to municipal water management plans.
Based on a spatial grouping analysis, four regions of increasing (upper Midwest, Louisiana, southeastern US, and western US) and decreasing (New England, Pacific Northwest, upper Great Plains, and Ohio River Valley) drought trends were found. Partial Pearson correlation and multiple regression were then used to isolate potential climatic explanations for the drought trends in these regions. There was a US-wide consensus on drought forcing by precipitation, as expected. However, many regions showed the importance of PET on recent drought trends. For areas with an increase in recent droughts, average air temperature was generally the second most important variable in determining recent drought trends. For areas where recent drought trends are decreasing, the results were more varied. Precipitation dominated these recent trends, more so than areas of increasing drought. Other climate variables, such as an increase in net radiation for the Ohio River Valley and increases in specific humidity for the upper Great Plains and Pacific Northwest, played important roles in determining trends in recent droughts. The results presented in this study can serve as a means for understanding how inter-regional differences in climatic changes are likely to affect future regional drought trends.
Acknowledgments
This material is based upon work supported by the National Science Foundation under Grant No. CNS-0521433. This research was supported in part by Lilly Endowment, Inc., through its support for the Indiana University Pervasive Technology Institute, and in part by the Indiana METACyt Initiative. The Indiana METACyt Initiative at IU is also supported in part by Lilly Endowment, Inc.