the Creative Commons Attribution 4.0 License.
the Creative Commons Attribution 4.0 License.
 | 06 Sep 2023
Hazard assessment modeling and software development of earthquake-triggered landslides in the Sichuan–Yunnan area, China
Xiaoyi Shao
Siyuan Ma
To enhance the timeliness and accuracy of spatial prediction of coseismic landslides, we propose an improved three-stage spatial prediction strategy and develop corresponding hazard assessment software named Mat.LShazard V1.0. Based on this software, we evaluate the applicability of this improved spatial prediction strategy in six earthquake events that have occurred near the Sichuan–Yunnan region, including the Wenchuan, Ludian, Lushan, Jiuzhaigou, Minxian, and Yushu earthquakes. The results indicate that in the first stage (immediately after the quake event), except for the 2013 Minxian earthquake, the area under the curve (AUC) values of the modeling performance are above 0.8. Among them, the AUC value of the Wenchuan earthquake is the highest, reaching 0.947. The prediction results in the first stage can meet the requirements of emergency rescue by immediately obtaining the overall predicted information of the possible coseismic landslide locations in the quake-affected area. In the second and third stages, with the improvement of landslide data quality, the prediction ability of the model based on the entire landslide database is gradually improved. Based on the entire landslide database, the AUC value of the six events exceeds 0.9, indicating a very high prediction accuracy. For the second and third stages, the predicted landslide area (Ap) is relatively consistent with the observed landslide area (Ao). However, based on the incomplete landslide data in the meizoseismal area, Ap is much smaller than Ao. When the prediction model based on complete landslide data is built, Ap is nearly identical to Ao. This study provides a new application tool for coseismic landslide disaster prevention and mitigation in different stages of emergency rescue, temporary resettlement, and late reconstruction after a major earthquake.
- Article
(14105 KB) - Full-text XML
-
Supplement
(781 KB) - BibTeX
- EndNote


Coseismic landslides are one of the most widespread and destructive hazards triggered by earthquakes in mountainous geological environments (Robinson et al., 2017). The Sichuan–Yunnan region of China has experienced frequent seismic activity due to the characteristics of crustal movement and the action of active faults (Cheng et al., 2020; Xu et al., 2005). Furthermore, due to its unique subtropical monsoon climate with rich and concentrated rainfall, the region is considered an intense coseismic-landslide-prone zone (Cui et al., 2009). Therefore, deep scientific understandings of the spatial distribution of earthquake-induced landslides in this area, followed by near-real-time emergency assessment (Cao et al., 2019; Tanyas et al., 2019) and medium- and long-term risk assessment (Guzzetti et al., 2005; Lari et al., 2014), can effectively reduce the landslide risk after the earthquake and also serve a role in emergency rescue and town planning (Lan et al., 2022).
Evaluation and production of landslide susceptibility mapping can be broadly categorized into three different types, including exploratory analysis based on professional experience, the Newmark model based on seismic landslide occurrence mechanism, and the data-driven machine learning model (Tian et al., 2020; Shao and Xu, 2022). In the application of expert knowledge, this method is heavily influenced by subjective human factors, so human experience error is unavoidable. The physically based Newmark model is widely used in seismic landslide hazard assessment of multiple earthquake events, including the 1994 Northridge, California, earthquake (Jibson et al., 2000); the 2008 Wenchuan earthquake (S. Ma and Xu, 2019); and the 2017 Jiuzhaigou earthquake (Liu et al., 2017). However, since the simplified Newmark method generalizes the calculation process and the input parameters of the evaluation results, the regional evaluation results are not ideal in earthquake emergency assessment (Liu et al., 2017; S. Y. Ma and Xu, 2019). In contrast, the data-driven machine learning method is frequently employed and has the widest application potential, such as in terms of information value (Demir et al., 2013), logistic regression (LR; Bai et al., 2015; Dai et al., 2001; Umar et al., 2014), fuzzy logic (Ercanoglu and Temiz, 2011; Kritikos et al., 2015), artificial neural networks (Pradhan and Saro, 2010), or support vector machines (Xu et al., 2012; Yao et al., 2008). Among them, the LR model is one of the most widely used models in the susceptibility assessment of earthquake-induced landslides by virtue of its simplicity, high efficiency, and high prediction accuracy (Shao and Xu, 2022; Reichenbach et al., 2018).
For a single earthquake event, rapidly identifying the high-hazard area of landslides is crucial for understanding the total earthquake impacts (Nowicki Jessee et al., 2019; Tanyas et al., 2019). However, the issue of the data-driven machine learning method is that the training model often needs detailed coseismic landslide data. Seismic landslide mapping is often a difficult and time-consuming task, hindered by issues related to the collection and processing of appropriate satellite or aerial images, cloud cover, and the slow speeds associated with manual identification and mapping of large numbers of landslides (Robinson et al., 2017). Consequently, the evaluation result based on data-driven methods lags behind practical emergency response and thus is unable to be of service in short-term disaster prevention and mitigation (Nowicki et al., 2014; He et al., 2021).
To address the issue that the current spatial prediction of coseismic landslides is not timely enough for practical application, Ma et al. (2020) propose a three-stage spatial prediction strategy for seismic landslides, including emergency response, temporary resettlement, and late reconstruction, and use this strategy in the 2013 Lushan earthquake event. In the emergency response stage, the Newmark model is used to carry out rapid emergency hazard mapping in the several hours after the earthquake. However, it should be noted that the Newmark model's prediction results are strongly influenced by the input parameters (Dreyfus et al., 2013), and obtaining relatively reasonable geotechnical parameters for a large area is extremely difficult (Wang et al., 2016; Zhuang et al., 2019). As a result, the accuracy of prediction results based on the Newmark model is relatively low, and it cannot meet the needs of emergency assessment (S. Y. Ma and Xu, 2019). At the same time, the three-stage prediction strategy has only been tested in the Lushan earthquake, and its applicability in other seismic events with different magnitudes and structural landform environments still needs to be determined.
In recent years, near-real-time coseismic landslide assessment models have become a powerful tool for fast estimates of ground failure hazards. The core of these models is to incorporate the hazard estimate from seismic events by including ShakeMap data for each earthquake (available in near real time from the USGS) combined with environmental factor data, thus allowing the model to be applied in near real time for future events. For example, Nowicki et al. (2014) combine shaking estimates with proxies for slope, geology, and wetness with 1 km resolution to develop a globally applicable model for near-real-time prediction of coseismic landslides based on four landslide inventories. Subsequently, Nowicki Jessee et al. (2019) expand the observational landslide data set which includes 23 landslide inventories and develop a new global empirical model. Tanyas et al. (2019) use 25 earthquake-induced landslides and 7 independent thematic variables based on the LR model to establish a global slope unit-based model for the near-real-time prediction of earthquake-induced landslides. Allstadt et al. (2018) select the 2016 Mw 7.8 New Zealand earthquake as a test case for evaluating the performance and near-real-time response applicability of three published global earthquake-induced landslide models, and the assessment results show that the global models have great potential in earthquake landslide emergency assessment. Simultaneously, Xu et al. (2019) propose a real probability prediction method of coseismic landslides, utilizing the Bayesian probability method and LR model, and establish a new generation of the Chinese earthquake-triggered landslide hazard model based on nine real earthquake-triggered landslide cases. However, the nationwide model's applicability in various earthquake cases with different tectonic and geomorphologic environments needs to be further tested.
In view of the issues encountered during the emergency assessment stage of the three-stage spatial prediction strategy for coseismic landslides, the aim of this study is to propose an improved three-stage spatial prediction strategy and develop corresponding hazard assessment software called Mat.LShazard V1.0. Based on this software, we evaluate the applicability of this improved spatial prediction strategy in six earthquake events that have occurred near the Sichuan–Yunnan region with different tectonic and geomorphologic environments. These include the 2008 Mw 7.9 Wenchuan earthquake, the 2014 Mw 6.6 Ludian earthquake, the 2013 Mw 6.6 Lushan earthquake, the 2017 Mw 6.5 Jiuzhaigou earthquake, the 2013 Mw 5.9 Minxian earthquake, and the 2010 Mw 6.9 Yushu earthquake. The results of this study are expected to provide technical supports for the emergency assessment and middle- and long-term hazard zoning of coseismic landslides in the Sichuan and Yunnan regions.
2.1 Geological setting
The Sichuan–Yunnan region is located on the eastern edge of the Tibetan Plateau. Because of Sichuan Basin blocking and the impact of fluid movement in the lower crust, tectonic activities in this region are extremely complex (Jiang et al., 2012; Zhang et al., 2003; Tapponnier et al., 2001). Furthermore, due to the intricate tectonic mechanisms, various types of active faults have developed, such as the Lancangjiang Fault, Jinshajiang Fault, Xianshuihe Fault, Longmenshan Fault, Anninghe Fault, Honghe Fault, and Xiaojiang Fault, as well as other fault zones, which control the occurrence of strong earthquakes in this area (Cheng et al., 2020; Xu et al., 2005; Ren et al., 2022). At least 16 earthquake events of magnitude 7.0 or larger have occurred since 1327, including four earthquakes with a magnitude larger than 8.0. As a result, this area has also become the most severely affected region associated with earthquake-induced landslide disasters (Huang and Fan, 2013; Zhao et al., 2021). Since 2008, multiple strong earthquakes have frequently struck this area, which has triggered massive coseismic landslides. For example, the 2008 Wenchuan earthquake killed tens of thousands of people, with landslides accounting for 30 % of the total loss from the earthquake (Cui et al., 2009). The 2013 Lushan earthquake killed 196 people, with 24 missing, at least 11 826 injured, and more than 968 seriously injured (Xu et al., 2013). These earthquake events induced a large number of coseismic landslides, which not only seriously threatened the safety of people's lives and property and traffic arteries, but also seriously affected the construction and operation of the Sichuan–Tibet railway, the Yunnan–Tibet railway, hydropower resource development, and other major national projects.
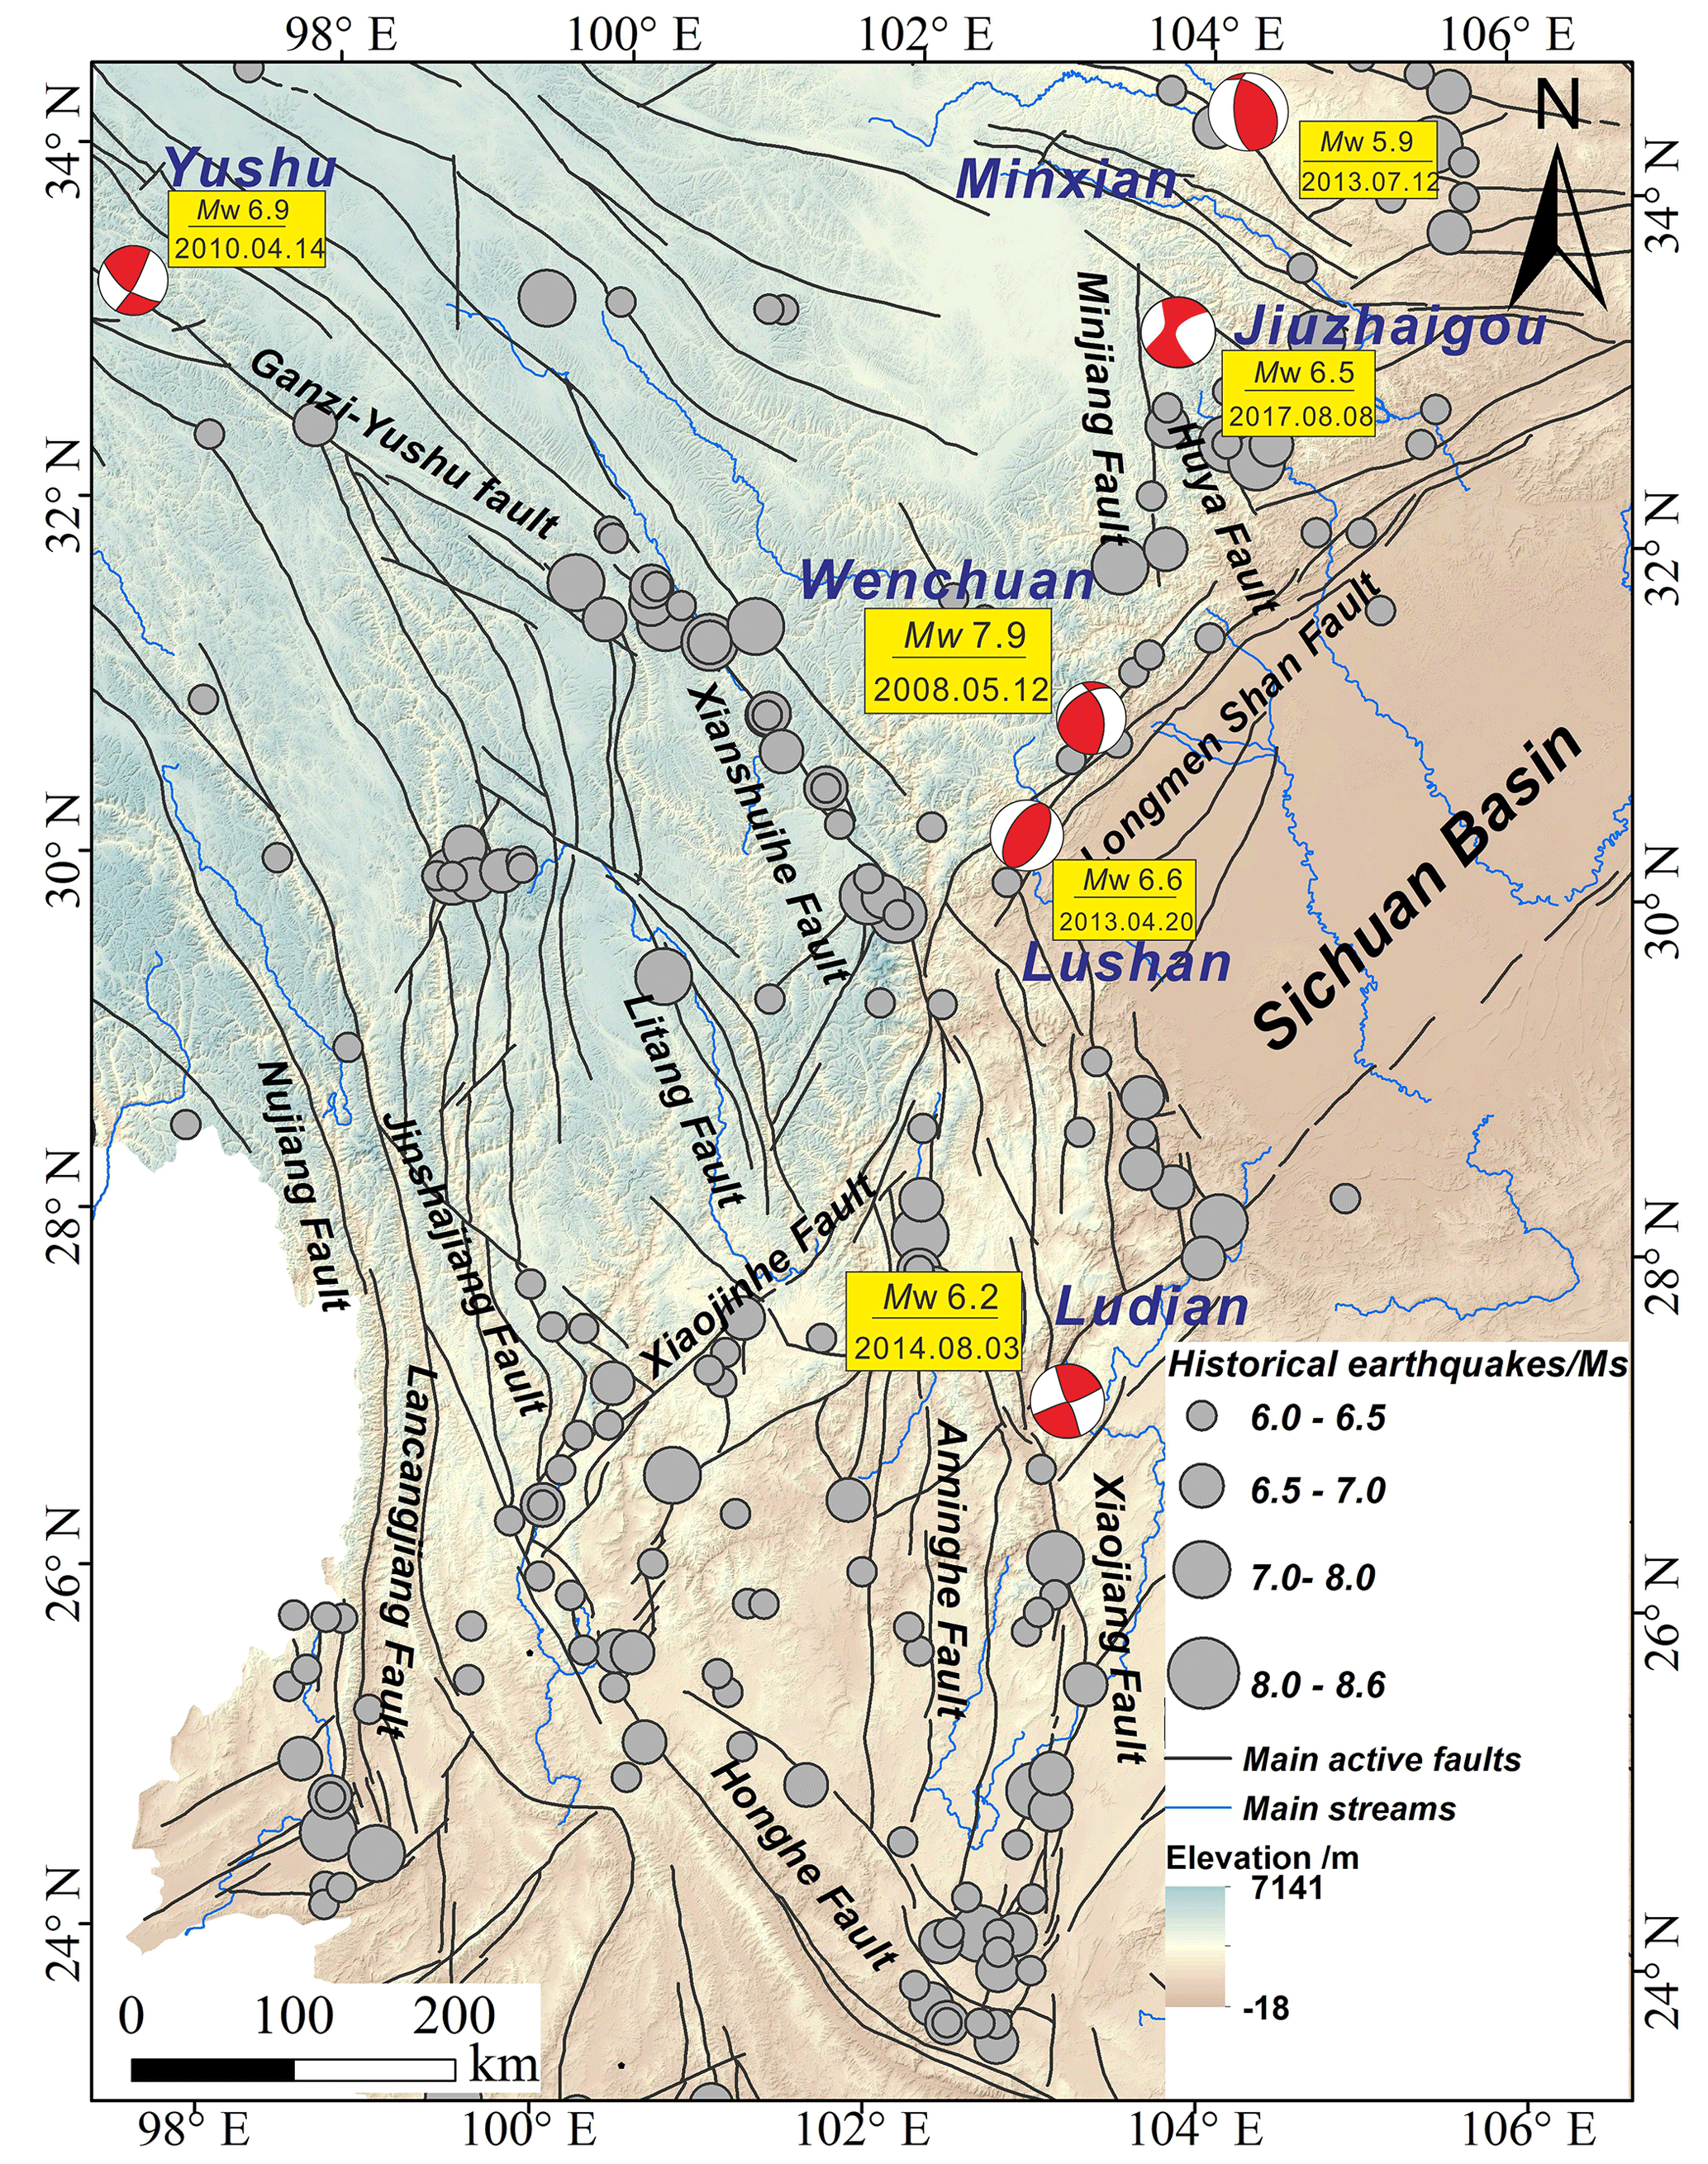
Figure 1Map showing the topography, earthquakes, and tectonic setting of the Sichuan–Yunnan region.
2.2 Six landslide inventories
Six landslide-triggered earthquakes have been investigated to test our model (Fig. 2). For all the available inventories, landslides have been mapped as polygons from aerial photographs and satellite images and also through field surveys including the 2008 Mw 7.9 Wenchuan earthquake (Xu et al., 2014a), the 2014 Mw 6.6 Ludian earthquake (Wu et al., 2020), the 2013 Mw 6.6 Lushan earthquake (Xu et al., 2015), the 2017 Mw 6.5 Jiuzhaigou earthquake (Tian et al., 2019), the 2013 Mw 5.9 Minxian earthquake (Xu et al., 2014b; Tian et al., 2016), and the 2010 Mw 6.9 Yushu earthquake (Xu and Xu, 2014). Landslides in these inventories are reported without differentiating landslide types. These landslide inventories have the following characteristics: (1) all landslides are mapped as polygons with clear boundary information; (2) all landslides are visually interpreted based on high-resolution images; (3) all landslides are delineated within the whole earthquake-affected area.
The 2008 Mw 7.9 Wenchuan earthquake is the result of sudden dislocation of the Yingxiu–Beichuan Fault in the Longmenshan fault zone (Xu et al., 2009). This earthquake ruptured two large thrust faults along the Longmenshan thrust belt and produced a 240 km long surface rupture zone along the Yingxiu–Beichuan Fault and a 72 km long surface rupture zone along the Guanxian–Jiangyou Fault. The earthquake triggered nearly 200 000 landslides, covering an area of about 311 880 km2.
The Mw 6.6 Lushan earthquake occurred on 14 April 2013 and was another strong earthquake that occurred in the southwest section of the Longmenshan mountain range following the 2008 Wenchuan earthquake. The earthquake triggered more than 22 528 landslides, covering an area of about 234.4 km2.
The Mw 5.9 Minxian earthquake on 12 July 2013 occurred along the Lintan–Dangchang Fault, located between the East Kunlun Fault and the northern margin of the West Qinling Fault (Zheng et al., 2013). The focal depth of this earthquake was 8.2 km. The earthquake triggered more than 6479 landslides, covering an area of about 830.2 km2.
The seismogenic structure of the Mw 6.6 Ludian earthquake is the NNW-striking Baogunao–Xiaohe Fault. The hypocenter is located at a depth of 12 km. The earthquake triggered more than 1024 landslides, covering an area of about 234.4 km2.
The Mw 6.5 Jiuzhaigou earthquake occurred on 8 August 2017 in Sichuan Province, China. The depth of the hypocenter was estimated to be around 9 km. The main seismogenic structure of this earthquake may be a branch of the Tazang Fault or the northern part of the Huya Fault. According to the focal mechanism solution, the strike of the seismogenic fault is NW–SE, the dip is SW, and the fault is a left-lateral strike-slip earthquake (Sun et al., 2018). The earthquake triggered about 5986 landslides, and the total area affected was about 9.6 km2.
The Mw 6.9 Yushu earthquake occurred near Qinghai Province on 4 April 2010. The hypocenter was located at a depth of 17 km within the Ganzi–Yushu strike-slip fault (Chen et al., 2010). The earthquake produced a surface fracture zone with a strike of about 300∘ and a length of 65 km. The surface rupture zone is characterized by a left-lateral strike-slip fault. The surface rupture zone is composed of a series of extrusion bulge and tension fractures (Chen et al., 2010). The earthquake triggered almost 2036 landslides within an area of about 1455.3 km2.
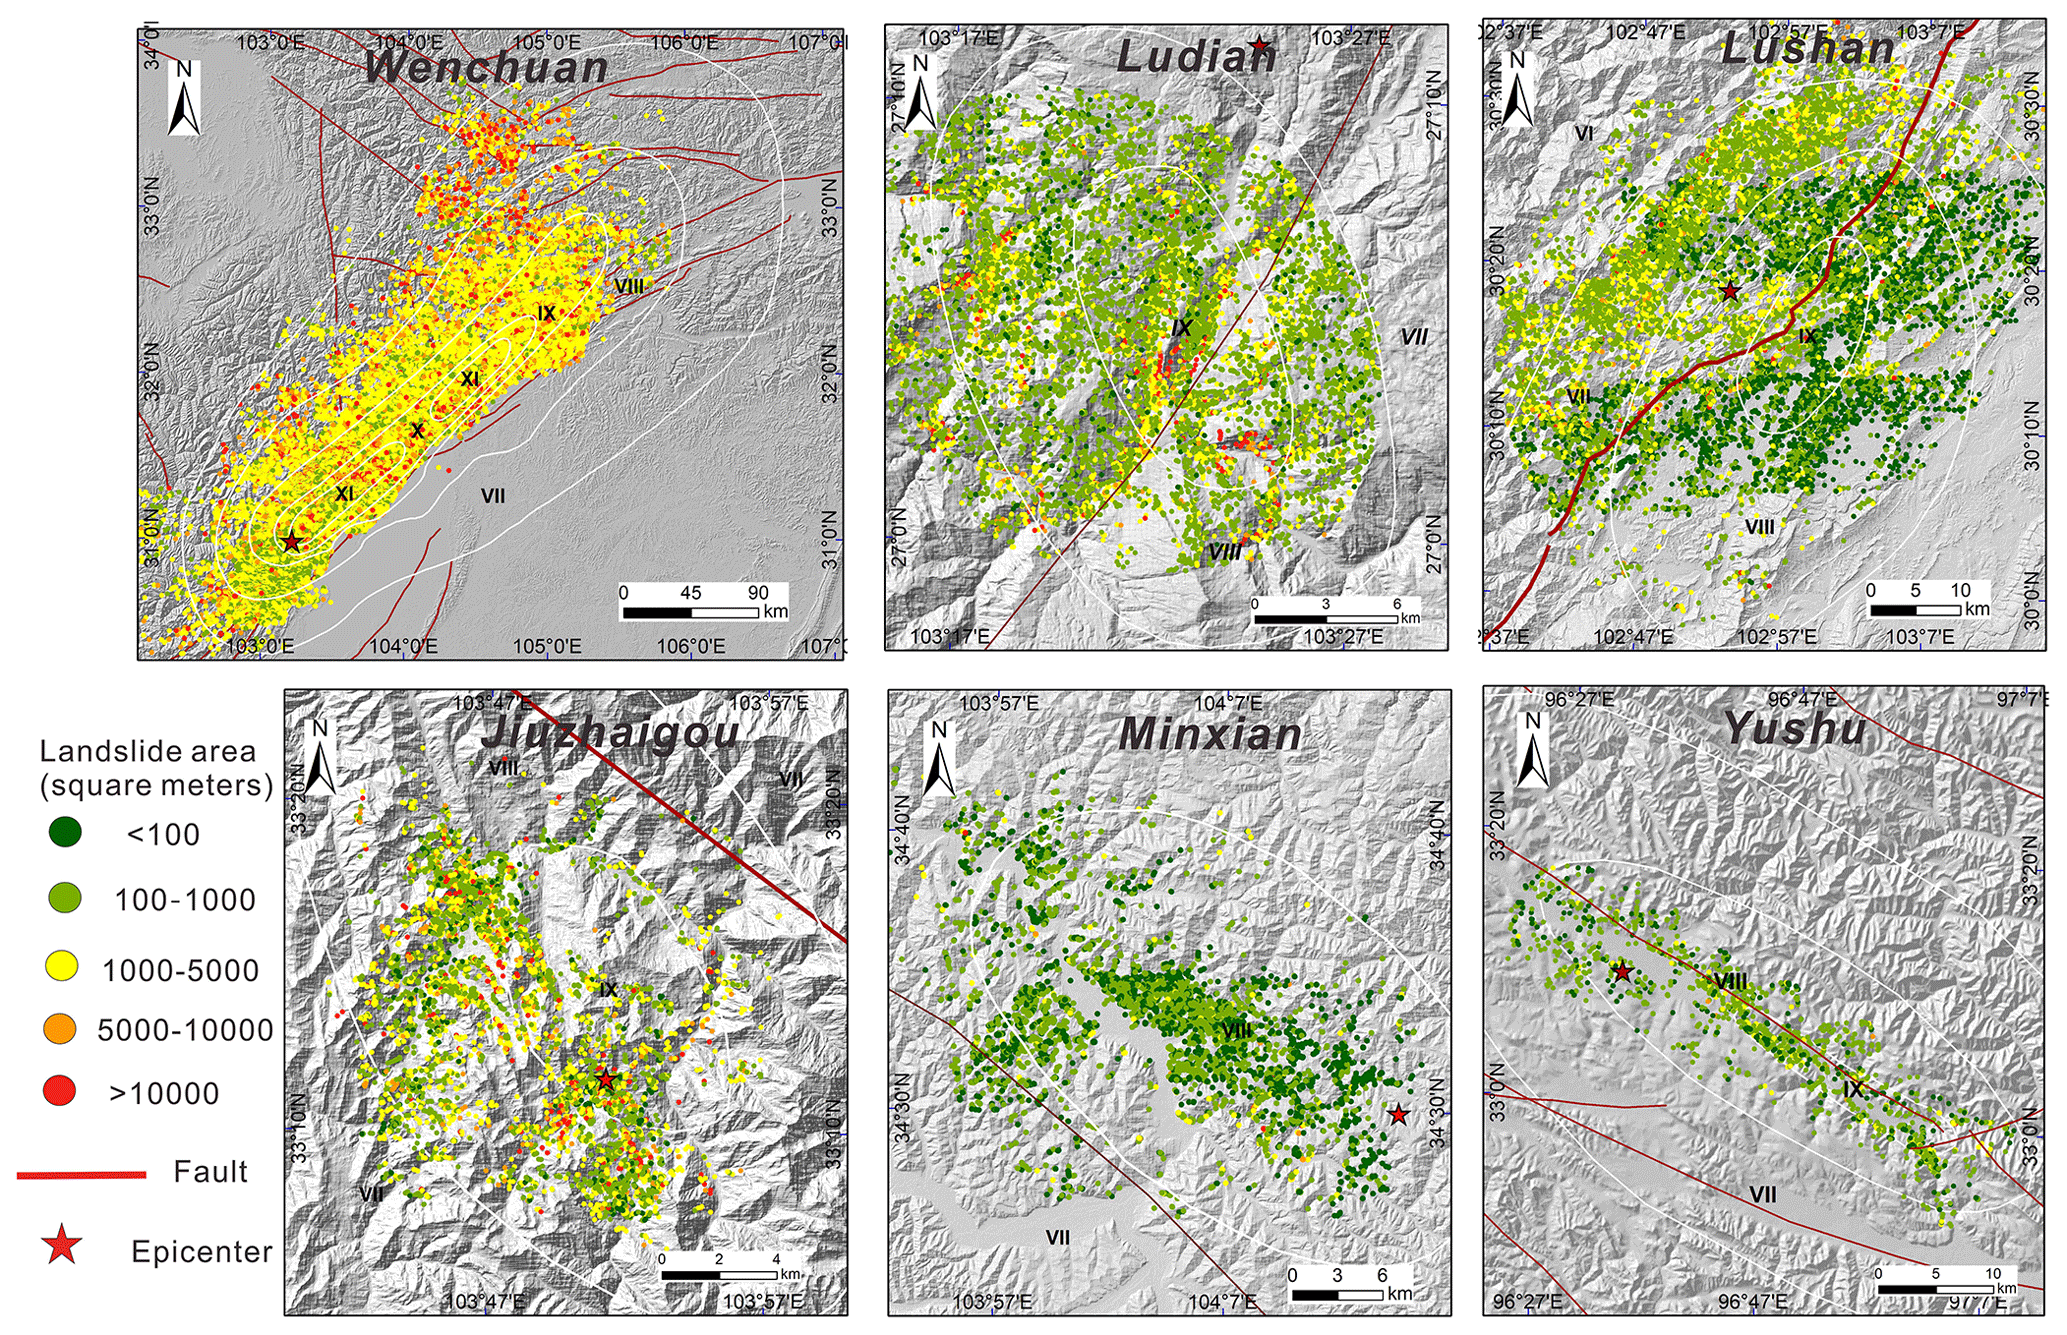
Figure 2Six earthquake-induced landslide inventories used in this study. White lines show the spatial distribution of the seismic intensity, provided by the China Earthquake Networks Center (CENC).
3.1 Data sources
Earthquake-induced landslides are mainly controlled by earthquakes, topography, geology, and hydrology, among other factors (Reichenbach et al., 2018; Nowicki Jessee et al., 2019). In this study, 11 influencing factors are selected to establish the LR model for the second and third stages, including the elevation, hillslope gradient, slope aspect, topographic relief, curvature, topographic wetness index (TWI), vegetation coverage percentage, distance from fault, lithology, annual average precipitation, and seismic intensity.
The elevation data are acquired from SRTM DEM, and their projection resolution is 30 m (Jarvis et al., 2008). The hillslope gradient, slope aspect, and curvature are extracted using these elevation data and ArcGIS software. Topographic relief and TWI are also computed using GRASS GIS based on the elevation data. The slope position is calculated by the Land Facet Corridor program (Jenness et al., 2013). We consider a global data set that represents the maximum green vegetation fraction (0 %–100 %) to characterize the vegetation coverage of the land area and the waterbodies; the vegetation coverage is assigned as −1 (Tateishi, 2010). The distribution of active fault data are acquired from a national seismicity fault database (Xu et al., 2016). The distances from the centroid of the grid cells to the nearest fault are calculated using ArcGIS. The distribution of seismic intensity for every seismic event is provided by the China Earthquake Networks Center (https://www.cenc.ac.cn/cenc/zgdztw/index.html, last access: 17 August 2021), and then the raster format for the seismic intensity is obtained by kriging interpolation.
The stratigraphic data are from the 1:2 500 000 geological map published by the China Geological Survey (http://dcc.cgs.gov.cn/, last access: 7 May 2021). We divide the lithology into 12 categories according to stratigraphic age: Quaternary (Q), Tertiary (R), Cretaceous (K), Jurassic (J), Triassic (Tr), Permian (P), Carboniferous (C), Devonian (D), Silurian (S), Ordovician (O), Cambrian (∈), and Precambrian (Pre∈). The annual average rainfall data are obtained from 1 km spatial resolution climate surfaces for global land areas of the WorldClim 2 data set (Fick and Hijmans, 2017). Finally, the spatial distribution of the 11 influencing factors is converted into a raster format with a grid cell size of 30 m.
3.2 Mat.LShazard V1.0 software description
3.2.1 The computational framework
A number of tools for landslide hazard assessment are already available in current studies, such as the GIS-based LSAT toolbox (Polat, 2021), LAND-SE implemented in R (Rossi and Reichenbach, 2016), r.landslide module based on GRASS GIS (Bragagnolo et al., 2020), GeoFIS (Osna et al., 2014), and LSAT PM v1.0 (Torizin et al., 2022), providing great convenience for us to conduct the regional landslide susceptibility assessment. However, to our knowledge, there is currently no specialized software for coseismic landslide hazard assessment, particularly regarding the various needs of different stages after a major earthquake.
Based on MATLAB, we develop earthquake-induced hazard assessment software named Mat.LShazard V1.0. This section describes the computational framework and operation of the software. A flowchart describing the module is presented in Fig. 3. Data input, model training, and model validation are the three main components of the software. Landslide data and the influencing factors of the study area are used for the input data. These data are in TIFF grid layer format. We employ the LR model for model training. We train the LR model using the aforementioned input data, and then we produce the seismic landslide hazard maps. Finally, in order to assess and confirm the accuracy of the model's prediction outputs, three indexes are chosen for the verification of the receiver operating characteristic (ROC) curve, the confusion matrix, and the predicted landslide area (Ap).
It is important to note that Mat.LShazard V1.0 is not the same as traditional landslide susceptibility software. The goal of this software is to meet the needs of various stages following a major earthquake. As a result, for different stages, we calculate seismic landslide hazard assessment results based on different LR models. For the emergency rescue stage I (immediately after the quake event), we select the new generation of the Chinese earthquake-triggered landslide hazard model (Xu2019 model), which is established by nine earthquake cases, including 306 435 real earthquake landslide records and 13 influencing factors with a 100 m resolution (Xu et al., 2019). A total of 13 influencing factors are selected for model conformation, including the elevation, topographic relief, hillslope gradient, slope aspect, slope curvature, slope position, topographic wetness index, land-cover type, vegetation coverage percentage, distance to the fault, lithology, average annual precipitation, and seismic intensity. More detailed theory and calculation procedures can be found in the Supplement. In the absence of seismic landslide data, this model can produce a seismic landslide hazard distribution map for stage I with only the seismic intensity map.
For temporary resettlement, stage II (hours to a few days (e.g., Planet)), remote sensing images can be gradually obtained following the earthquake. Based on visual interpretation or automatic identification, we can obtain the seismic landslide distribution map of the meizoseismal area, which can be used as the preliminary results of this event. We choose the influencing factors that are similar to the model's input for the second and third stages so that we can easily compare the regression coefficient changes of different influencing factors in different stages and thus explain the relationship between each influencing factor and the earthquake-induced landslide occurrence. Combining the above influencing factors with a 30 m resolution and incomplete landslide data, we can establish a new LR model and provide the seismic landslide hazard distribution map for stage II.
For late reconstruction, stage III (a few days to weeks (e.g., Planet, Sentinel-2, Landsat 8/Landsat 9)), a large number of remote sensing images collected before and after the earthquake in the quake-affected area can be obtained, which can effectively cover the entire earthquake area and achieve the establishment of a comprehensive earthquake-induced landslide inventory. In stage III, we are faced with the problem of not only identification of the coseismic landslide, but also the weakened slope caused by the quake. As a result, it is critical to locate areas of landslide that are stable during the earthquake but unstable for a period of time after the earthquake. At this stage, we combine the complete landslide data and influencing factor data with a 30 m resolution to train and update the LR model and then provide the seismic landslide hazard map for stage III. Therefore, the results obtained in stage III will definitely be more objective than those obtained in stage II because the training samples used in the model in this stage are more abundant and objective.
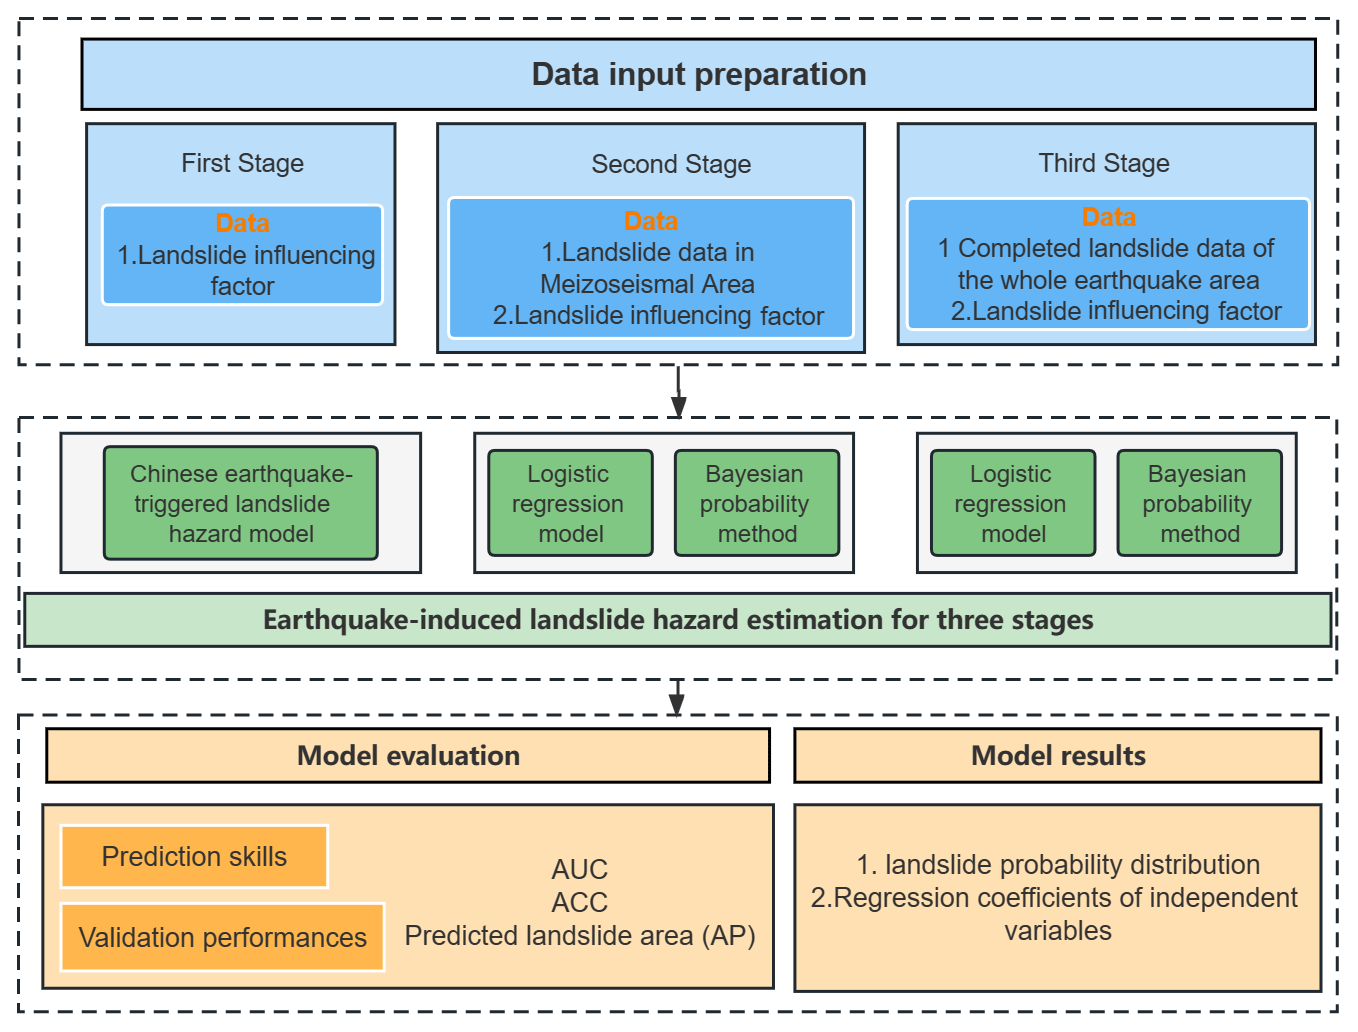
Figure 3Logical schema of the Mat.LShazard V1.0 software for earthquake-induced hazard assessment.
3.2.2 Logistic regression model
A logistic regression (LR) model is a statistical model that predicts the probability of one event taking place by having the log odds (the logarithm of the odds) for the event be a linear combination of one or more independent variables (“predictors”) (Dai and Lee, 2002; Merghadi et al., 2020; Tolles and Meurer, 2016). It is a nonlinear multivariate statistical model that has been widely used in landslide hazard modeling by virtue of its simplicity, high efficiency, and high prediction accuracy (Massey et al., 2018; Broeckx et al., 2018; Allstadt et al., 2018; Lin et al., 2017; Reichenbach et al., 2018). It is also the preferred method for establishing the near-real-time prediction model of earthquake-induced landslides (Tanyas et al., 2019; Xu et al., 2019; Nowicki Jessee et al., 2019). An LR model converts dependent variables into binary logic variables that occur (recorded as 1) and do not occur (recorded as 0). The relationship between the landslide occurrence probability and impact factors can be expressed as
where P represents the probability of landslide occurrence, ranging from 0 to 1. Z represents the sum of linear weight values after variable superposition. χi denotes each impact factor, and βi is the corresponding regression coefficient.
3.2.3 Bayesian probability method
The aim of this study is to develop a probability estimator for predicting the areal extent of landslides. In other words, we correlate the resulting probability with spatial extent (e.g., areas labeled “5 % probability of landsliding” contain about 5 % landslides by area) (Shao et al., 2020b; Nowicki Jessee et al., 2019). As a result, we generate sample points randomly in the study area. The points within the landslide area are sliding samples, while the others are not; such a setting ensures that the ratio of sliding to non-sliding is equivalent to the probability of coseismic landslides occurring in the study area (Shao et al., 2020b). The coseismic landslide probability (Pcols) in the region is simply defined as the ratio of the area of all landslides to the total area of the region based on Bayesian theory:
where Al is the total area of all coseismic landslides and As is the area of the entire study area.
Based on the above Bayesian probability method and the corresponding landslide surface data, the corresponding landslide sample points and non-landslide sample points can be randomly generated; thus, the predictive model can be constructed.
3.2.4 Model validation
In this study, three indexes including the receiver operating characteristic (ROC) curve, the confusion matrix, and the predicted landslide area (Ap) are used to evaluate our results. First, we assess the modeling performance by checking the variation in area under the curve (AUC) value (varying between 0.5 for a random classification model and 1 for the best performance), which is a metric referring to the area under the ROC curve (Swets, 1988; Brenning, 2005). Second, we use the confusion matrix for the performance evaluations of the prediction results. The confusion matrix consists of four basic characteristics (numbers) that are used to define the measurement metrics of the classifier, which are TP (true positive), TN (true negative), FP (false positive), and FN (false negative) (Fawcett, 2006). One of the most commonly employed metrics for classification is accuracy. The accuracy of a model through a confusion matrix is calculated using the formula expressed as
Otherwise, in order to evaluate the model prediction performance, we compute the predicted landslide area (Ap) as a metric to summarize the total hazard estimated by a given model for a given earthquake with a single number. The probability value of each grid multiplied by the grid area represents the predicted landslide area in each grid. The predicted landslide area in the study area can be obtained by all grids' superposition (Shao et al., 2020b; Allstadt et al., 2018). The predicted landslide area (Ap) is computed by Eq. (5) (Shao et al., 2020b; Allstadt et al., 2018).
in which pi,j is the probability of a landslide at pixel i and j, m is the number of rows, n is the number of columns, and A is the pixel area (constant).
4.1 First stage
The landslide hazard estimate of the six earthquake events in the first stage (immediately after the event) is obtained using the Chinese earthquake-triggered landslide hazard model (Xu et al., 2019). The predicted results in our software can be processed at the first stage by entering the seismic intensity maps of the six cases produced by CENC. Figure 4 shows the predicted probability distribution for the six earthquake events in the first stage. Overall, the Chinese earthquake-triggered landslide hazard model has different forecasting abilities for different earthquake events. For the Wenchuan earthquake, the prediction results in this stage are reliable. The regions with high hazard are primarily found to have intensity X and XI, and the distribution of actual landslides also reveals that nearly 80 % of the landslides are concentrated in the northeast area with intensity X and XI. In addition, for the 2013 Lushan earthquake and the 2017 Jiuzhaigou earthquake, most of the actual landslides are basically located in high-hazard areas. Especially for the Lushan earthquake, the prediction results can better forecast the northwest region located in the epicenter region, which corresponds to the landslide-concentrated area. For the 2010 Yushu earthquake, the high-hazard area is located in the southeast region with intensity VII and the whole region with intensity IX. The actual coseismic landslides of the Yushu earthquake are primarily distributed in regions with intensity IX, indicating that with the exception of the overestimated southeast region with intensity VII, the remaining area can accurately predict the potential high-hazard areas. However, the prediction results of the 2013 Minxian earthquake are barely satisfactory. According to Fig. 4e, the high-hazard-prediction areas are primarily concentrated in the northwest region with intensity VII and the southwest region with intensity VIII. However, according to the actual distribution of landslides, most of the landslides triggered by this earthquake are located in the central region with intensity VIII. Namely, the prediction results do not accurately predict the actual landslide distribution, and the majority of coseismic landslides occur in low-hazard-prediction areas.
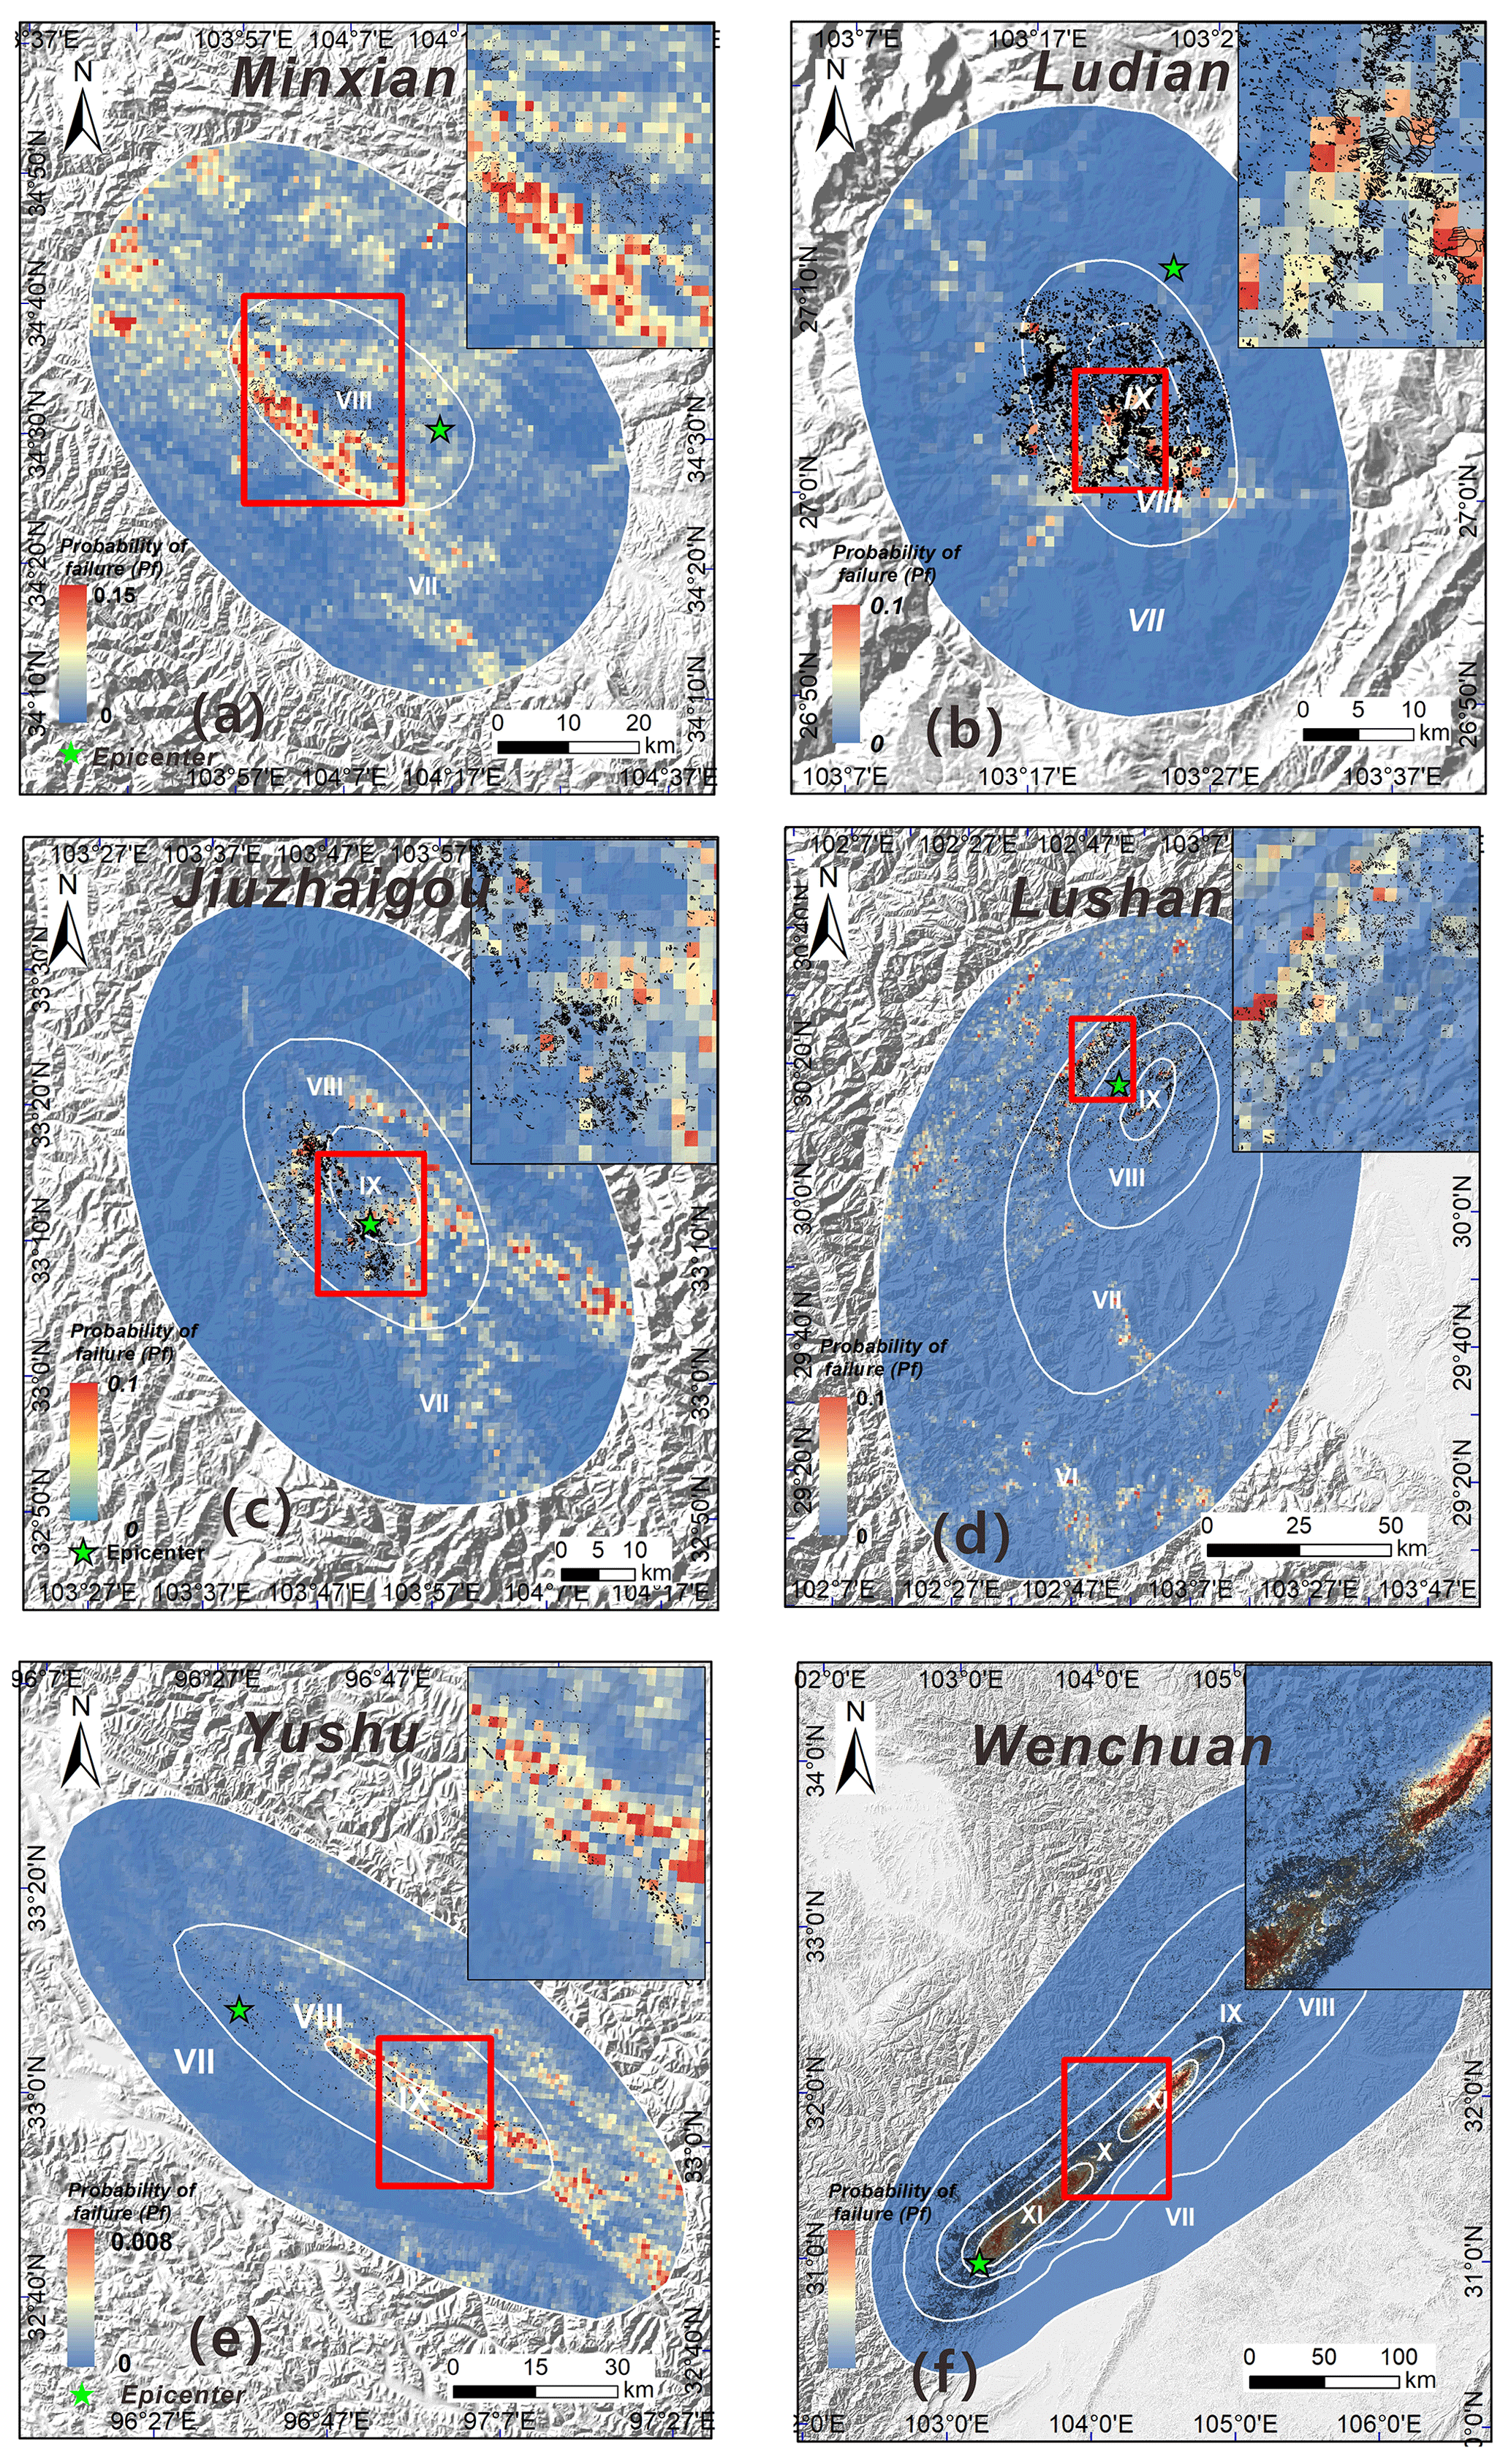
Figure 4Maps showing the predicted landslide probability distribution for the six earthquake events in the first stage: (a) the 2013 Mw 5.9 Minxian earthquake; (b) the 2014 Mw 6.6 Ludian earthquake; (c) the 2017 Mw 6.5 Jiuzhaigou earthquake; (d) the 2013 Mw 6.6 Lushan earthquake; (e) the 2010 Mw 6.9 Yushu earthquake; (f) the 2008 Mw 7.9 Wenchuan earthquake.
We compare the predicted landslide area (Ap) in the first stage with the actual landslide area. Figure 5 shows that the slope of the fitting curve between the predicted and actual areas of the six earthquakes is close to 1. The Ap values for the Yushu, Lushan, and Wenchuan earthquakes are on the high side, with an error range of 50 %–78 %. On the other hand, the Ap values of Minxian, Ludian, and Jiuzhaigou earthquake are on the low side, with an error range of 17 %–30 %. In general, the prediction results meet the requirements of emergency rescue by quickly obtaining the predicted information of the possible coseismic landslide locations in the whole quake-affected area.
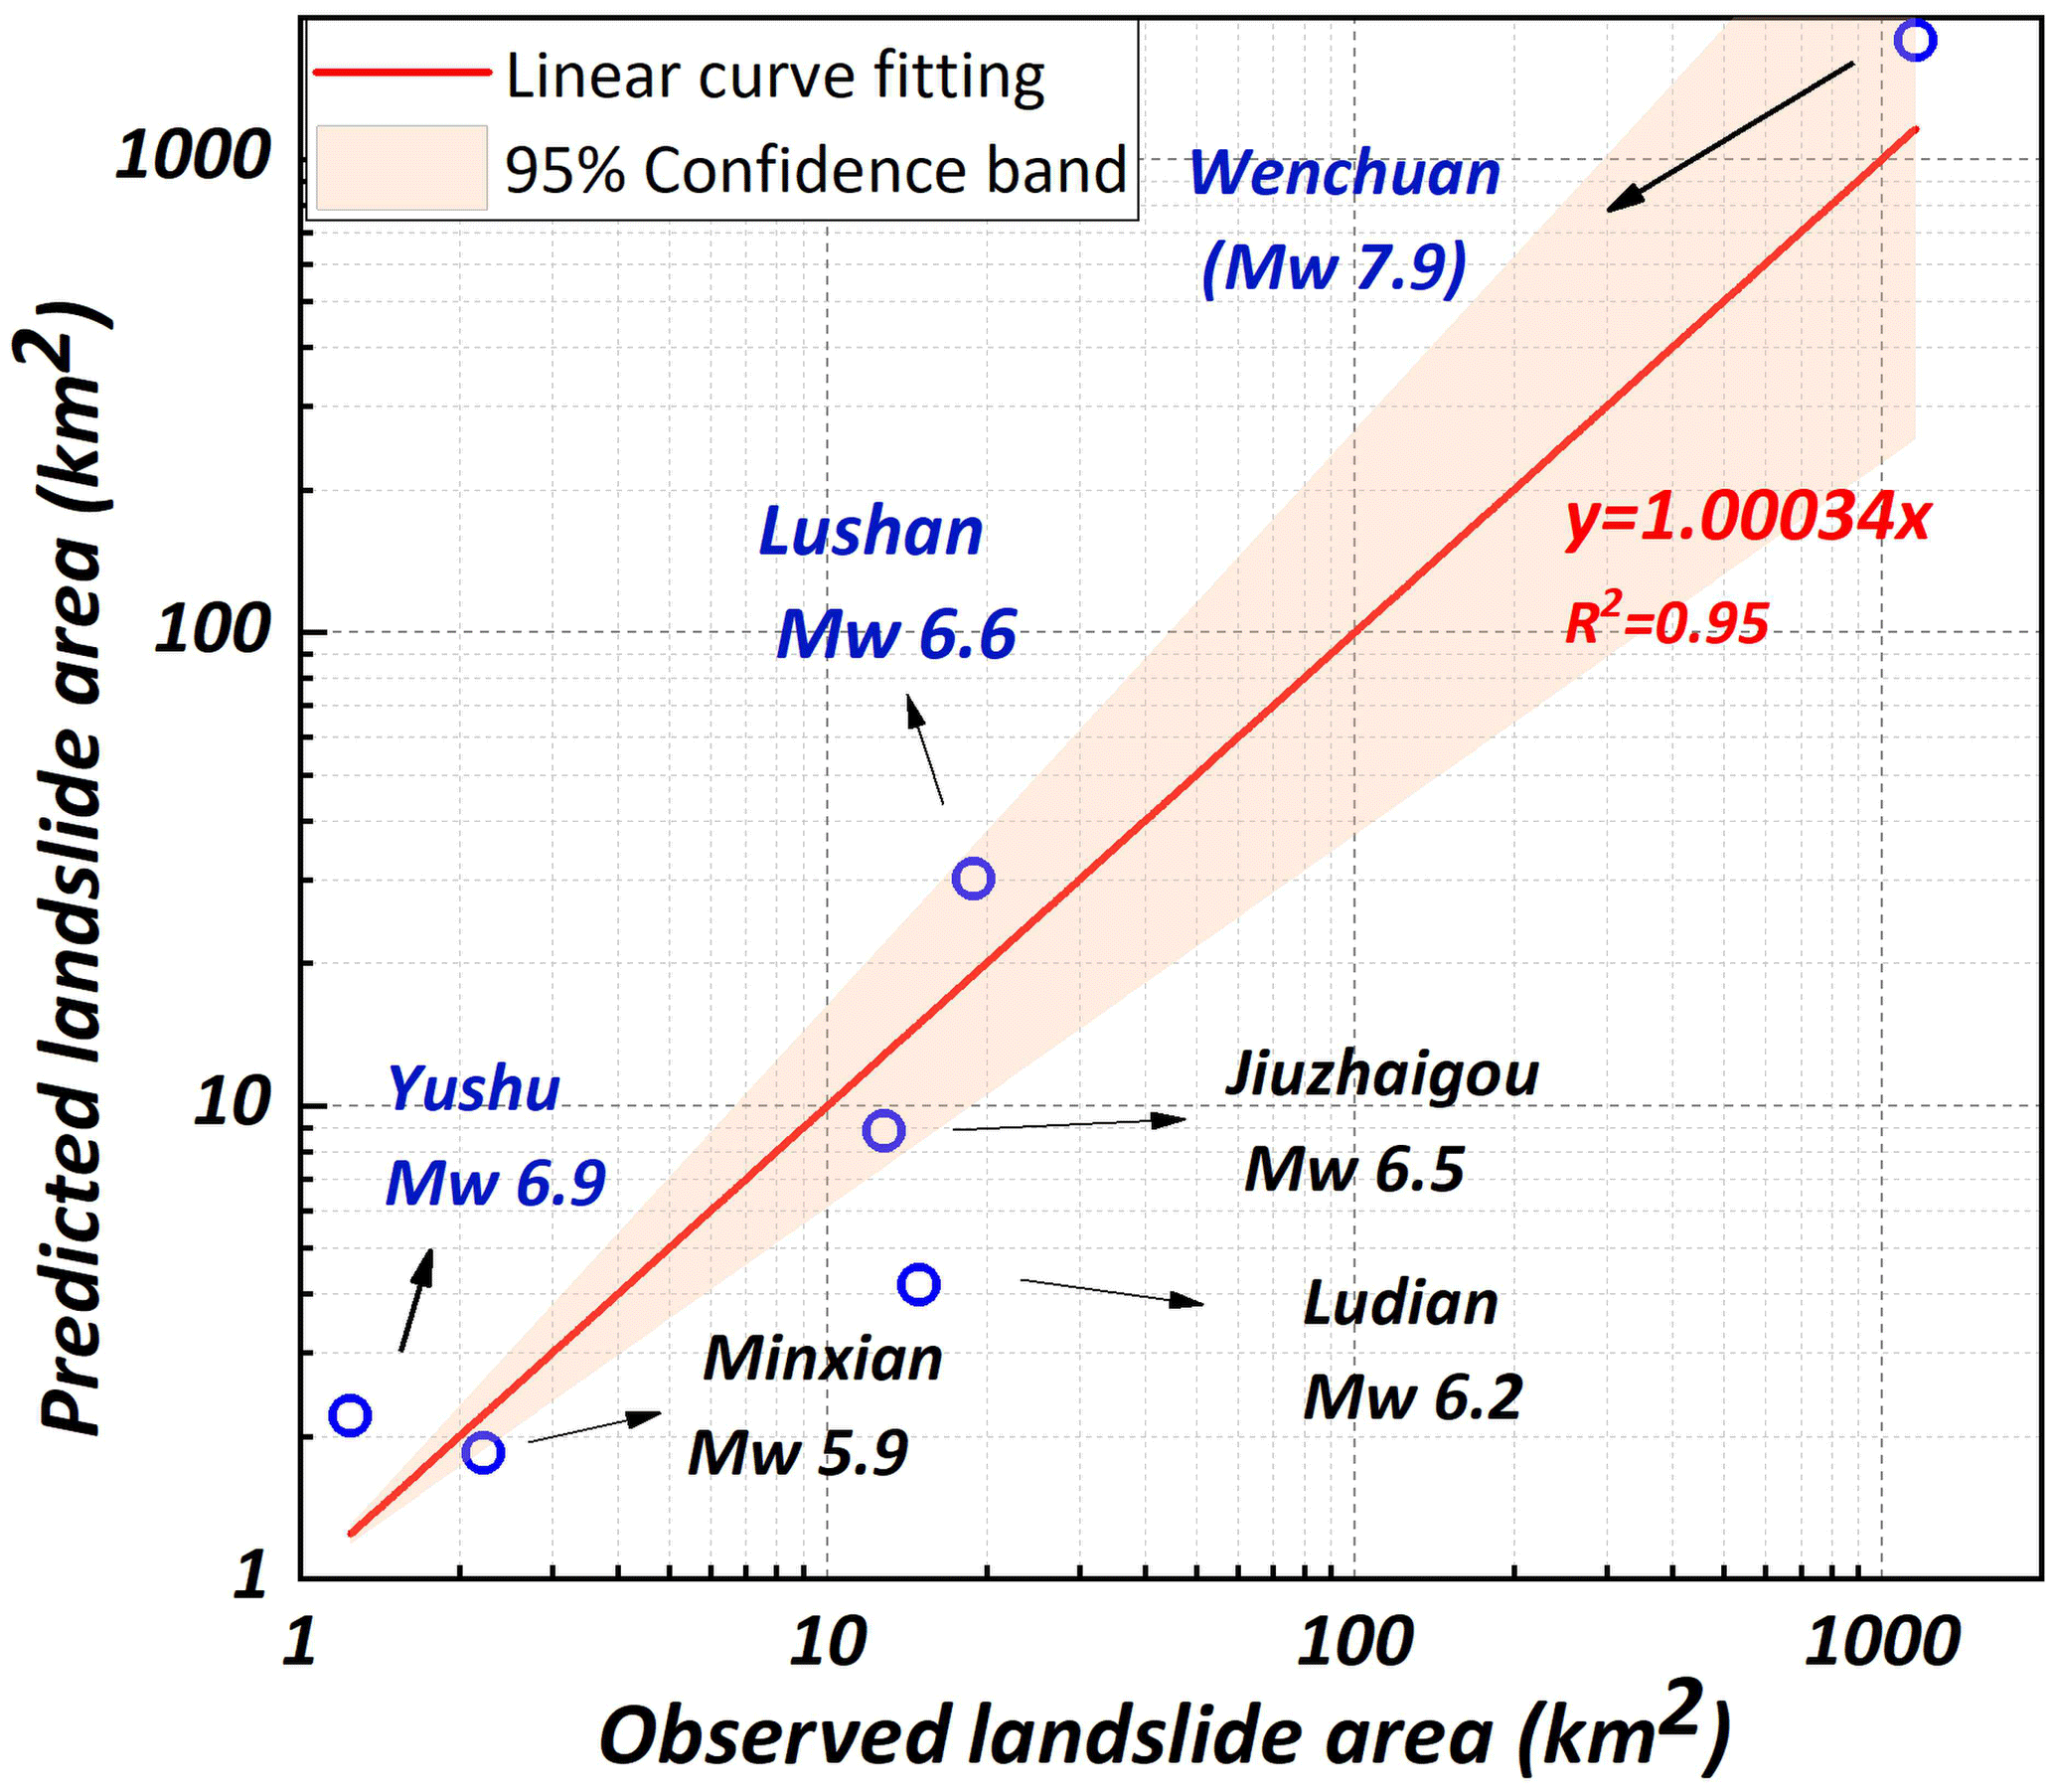
Figure 5Relationships between the observed landslide area (Ao) and the predicted landslide area (Ap) for the six earthquake events in the first stage.
4.2 Second and third stages
As mentioned in Sect. 3.2.1, for the landslide hazard prediction of the second and third stages, we train the evaluation model of these two stages using landslide data from the meizoseismal area and the whole quake-affected area, respectively. To reduce the stochastic effects of data sampling, we calculate the LR model by randomly selecting the training samples considering the uncertainty in the samples (Shao et al., 2020b; Tanyas et al., 2019). We choose 70 % of all samples at random and independently repeated experiments 50 times to construct the LR model. All the predicted models for the six earthquake cases are run 50 times, yielding 50 predicted pictures of potential landslides in the study area for each event.
Figure 6 shows the mean predicted probability distribution of the six events in the second stage (hours to a few days (e.g., Planet)). The majority of the high-hazard areas of the six earthquakes are located in high-intensity areas. For example, the high-hazard areas of the Ludian earthquake are concentrated in the meizoseismal area, which is essentially consistent with the actual landslide distribution. However, in the southwest region where landslides are well developed beyond the meizoseismal area with intensity VIII, the landslide density is high but the prediction probability is quite low. Similar phenomena have been observed with respect to the Jiuzhaigou and Lushan earthquakes. The above phenomenon is less obvious in the other three earthquake events: the Minxian, Wenchuan, and Yushu earthquakes. For instance, the seismogenic fault of the Yushu earthquake is a left-lateral strike-slip fault, and thus the majority of the coseismic landslides are basically distributed along both sides of the seismogenic fault. The high-hazard areas of the Yushu earthquake are distributed in the meizoseismal area on both sides of the seismogenic fault, and these areas essentially correspond to the main development areas of seismic landslides.
To obtain the prediction probability distribution map of the third stage, we use all available landslide data from the entire earthquake-affected region (a few days to weeks (e.g., Planet, Sentinel-2, Landsat 8/Landsat 9)). Based on the same method, 70 % of all samples are used for modeling, and then 50 model results are generated by repeating 50 experiments. Figure 7 shows the mean probability distribution of the six events in the third stage. Compared to the second stage, the predicted results in the third one are more consistent with the actual landslide distribution. The majority of actual landslides are basically distributed in areas with high hazard, indicating that the evaluation model has high prediction ability at this stage. Particularly for the Ludian, Jiuzhaigou, and Lushan earthquakes, the assessment results can better predict the actual landslide distribution in all earthquake-affected areas.
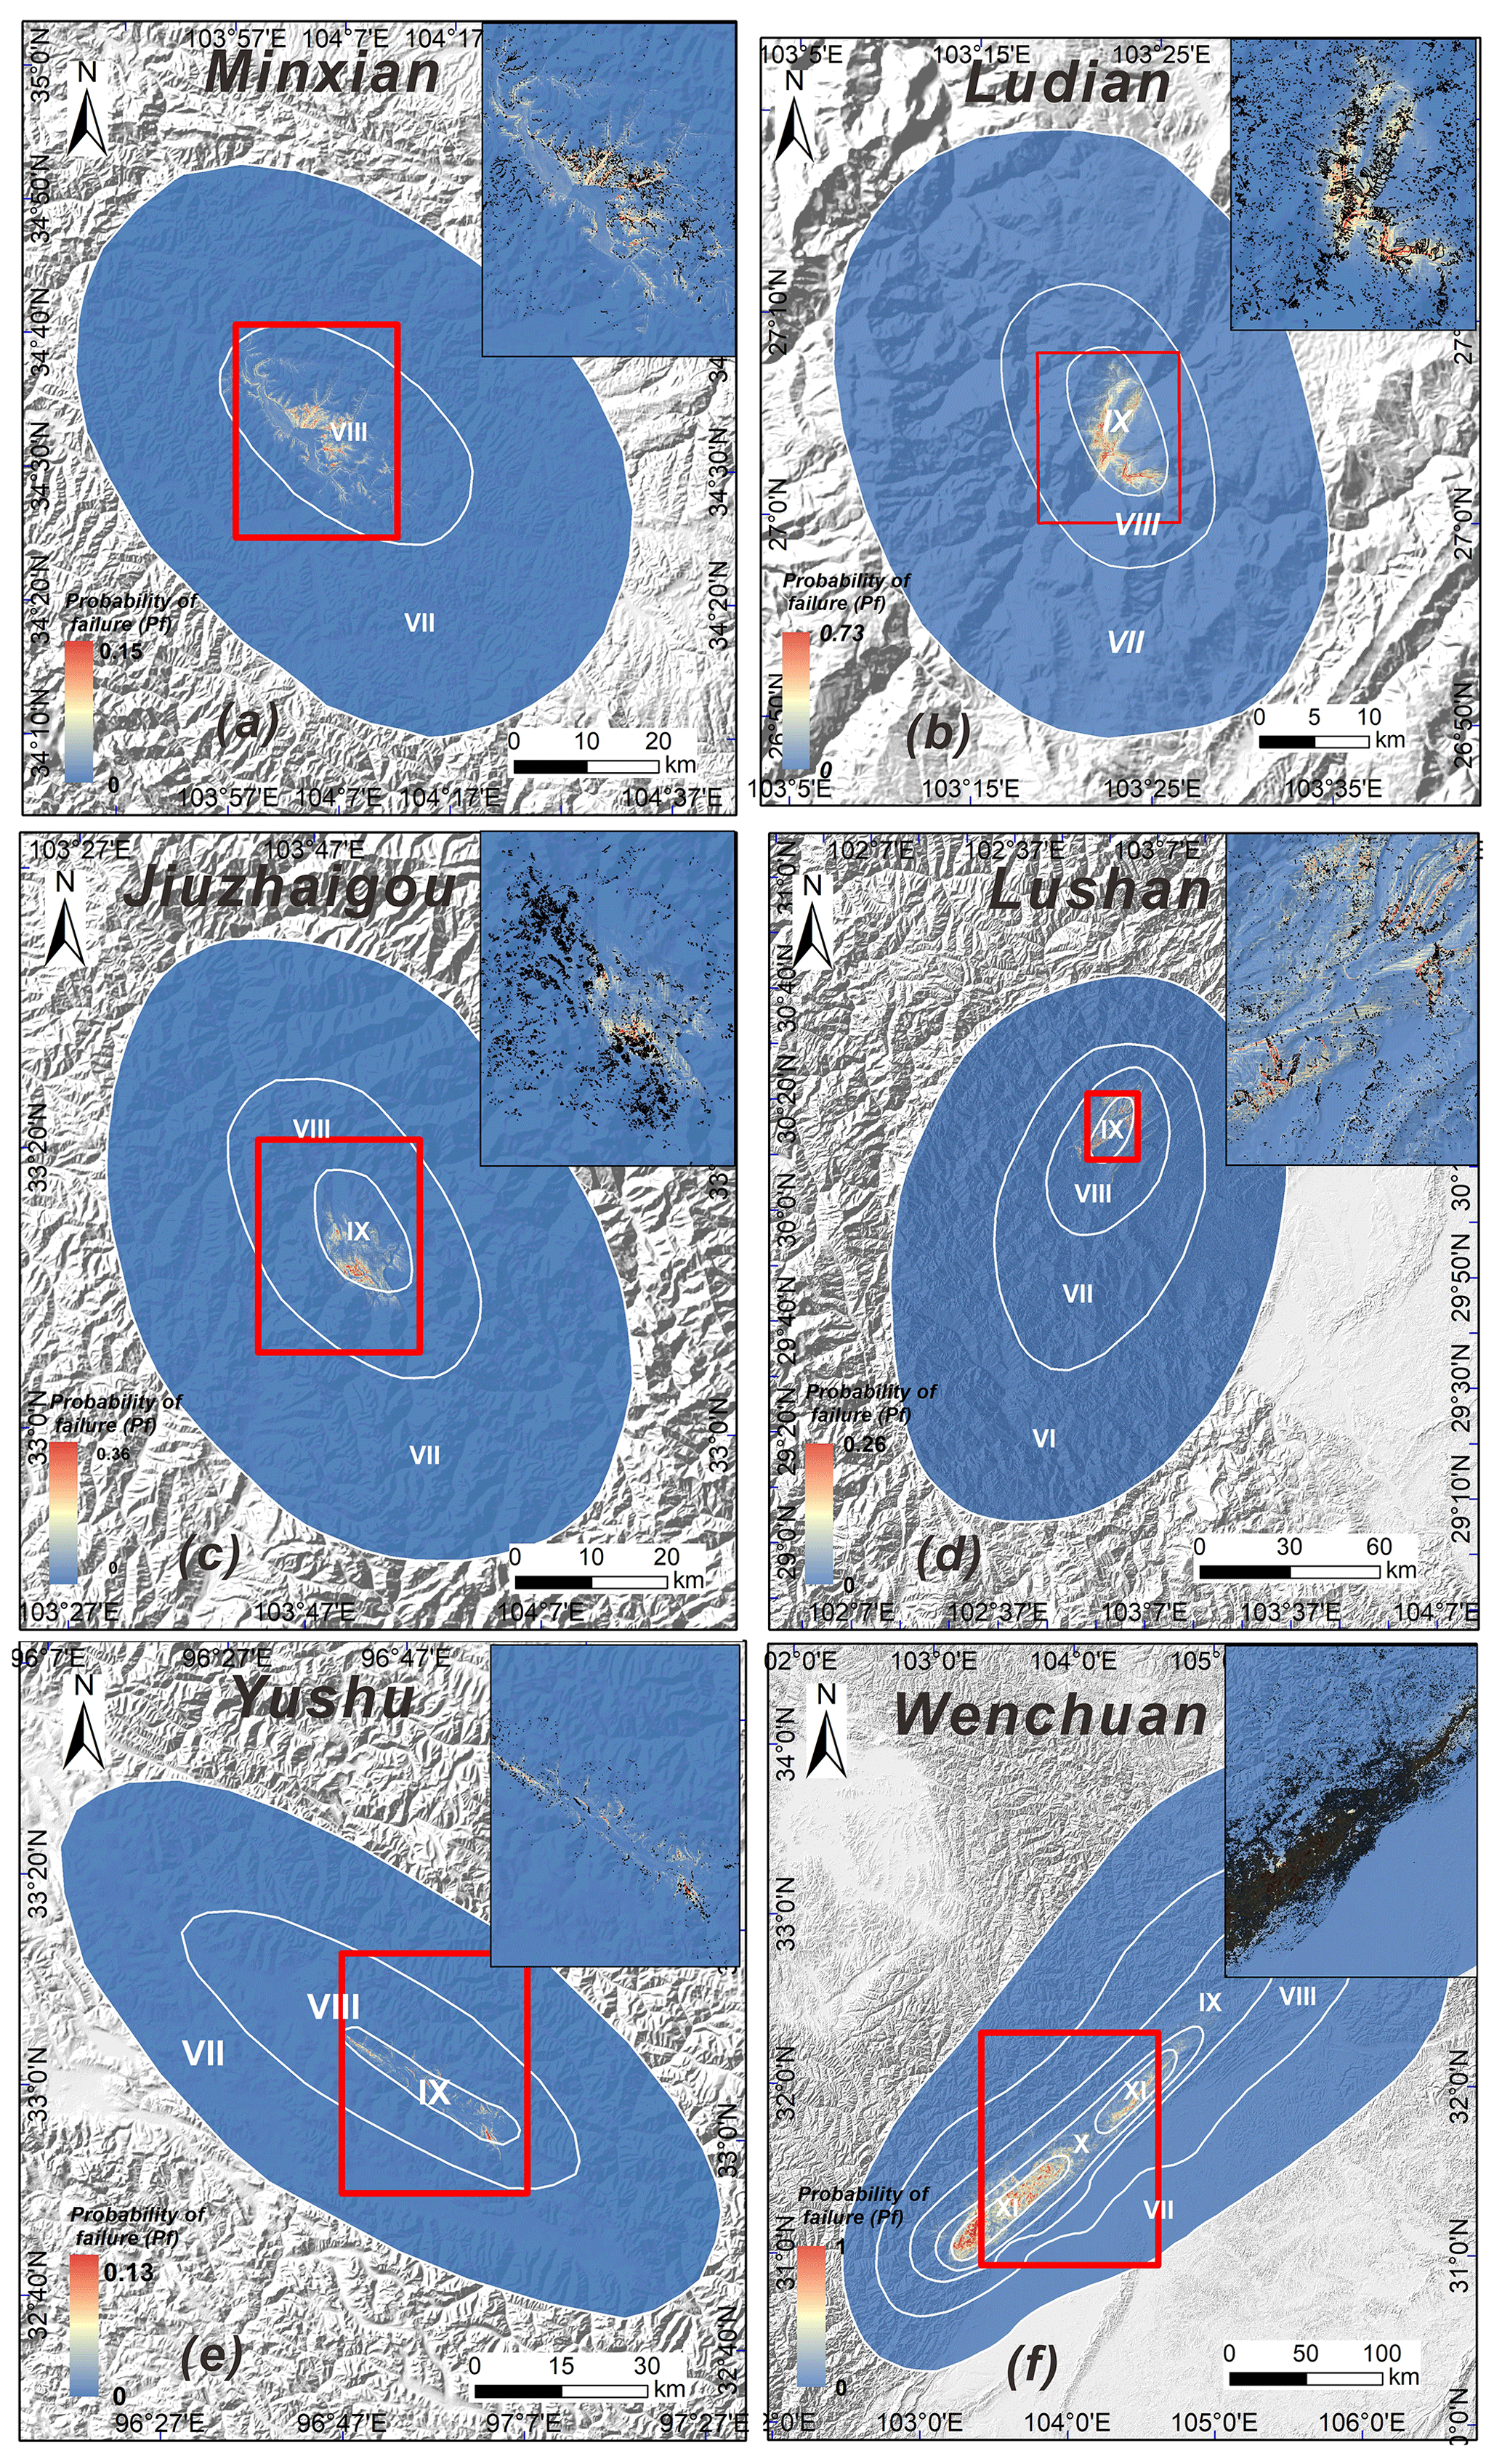
Figure 6Maps showing the predicted landslide probability distribution for the six earthquake events in the second stage: (a) the 2013 Mw 5.9 Minxian earthquake; (b) the 2014 Mw 6.6 Ludian earthquake; (c) the 2017 Mw 6.5 Jiuzhaigou earthquake; (d) the 2013 Mw 6.6 Lushan earthquake; (e) the 2010 Mw 6.9 Yushu earthquake; (f) the 2008 Mw 7.9 Wenchuan earthquake.
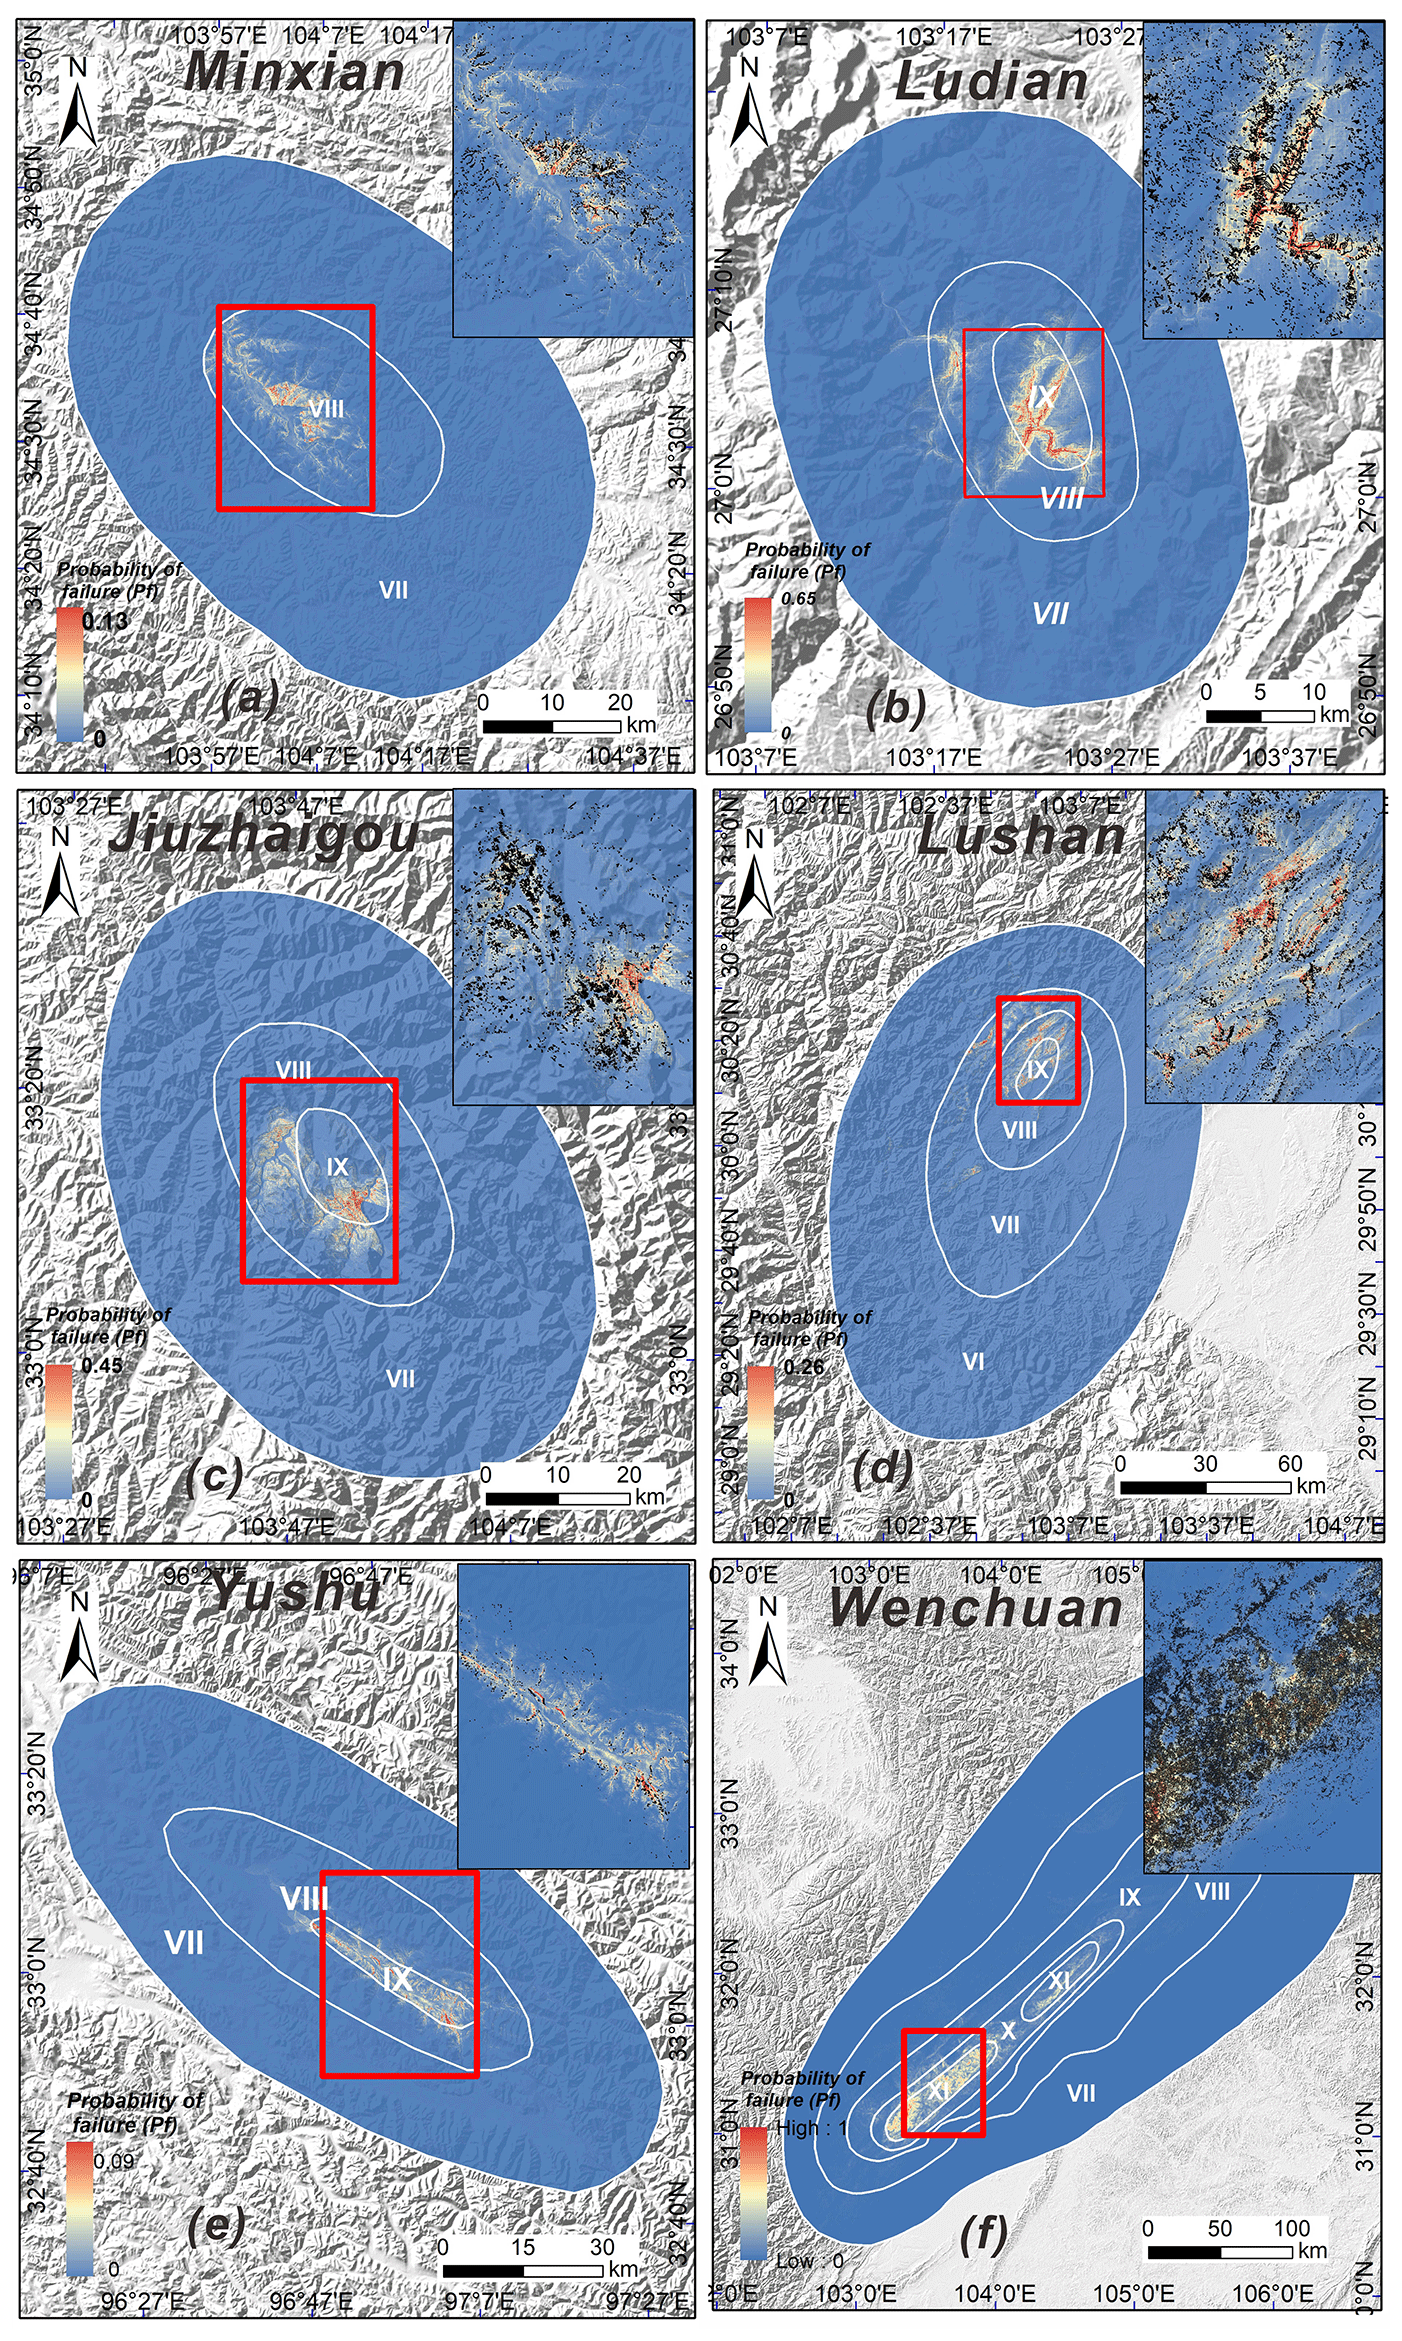
Figure 7Maps showing the predicted landslide probability distribution for the six earthquake events in the third stage: (a) the 2013 Mw 5.9 Minxian earthquake; (b) the 2014 Mw 6.6 Ludian earthquake; (c) the 2017 Mw 6.5 Jiuzhaigou earthquake; (d) the 2013 Mw 6.6 Lushan earthquake; (e) the 2010 Mw 6.9 Yushu earthquake; (f) the 2008 Mw 7.9 Wenchuan earthquake.
Figure 8 shows the relationships between the observed landslide area (Ao) and the predicted landslide area (Ap) for the six earthquake events in the second and third stages. The results show that whether in the second or third stage, Ap is in good agreement with Ao. In the second and third stages, the slopes of the fitting curves of the two stages are 0.86 and 1.01, respectively. In addition, we can observe that in the second stage, the Ap values of the six earthquakes are generally lower than the corresponding Ao values, and the overall error is between 9 % and 74 %. Among them, the prediction error of the Wenchuan earthquake is the lowest (9 %) and the error of the Jiuzhaigou earthquake is the highest, reaching 74 %. For the six cases in the third stage, Ap is basically consistent with Ao, and the error range is about 1 %, showing high performance of the LR model in this stage.
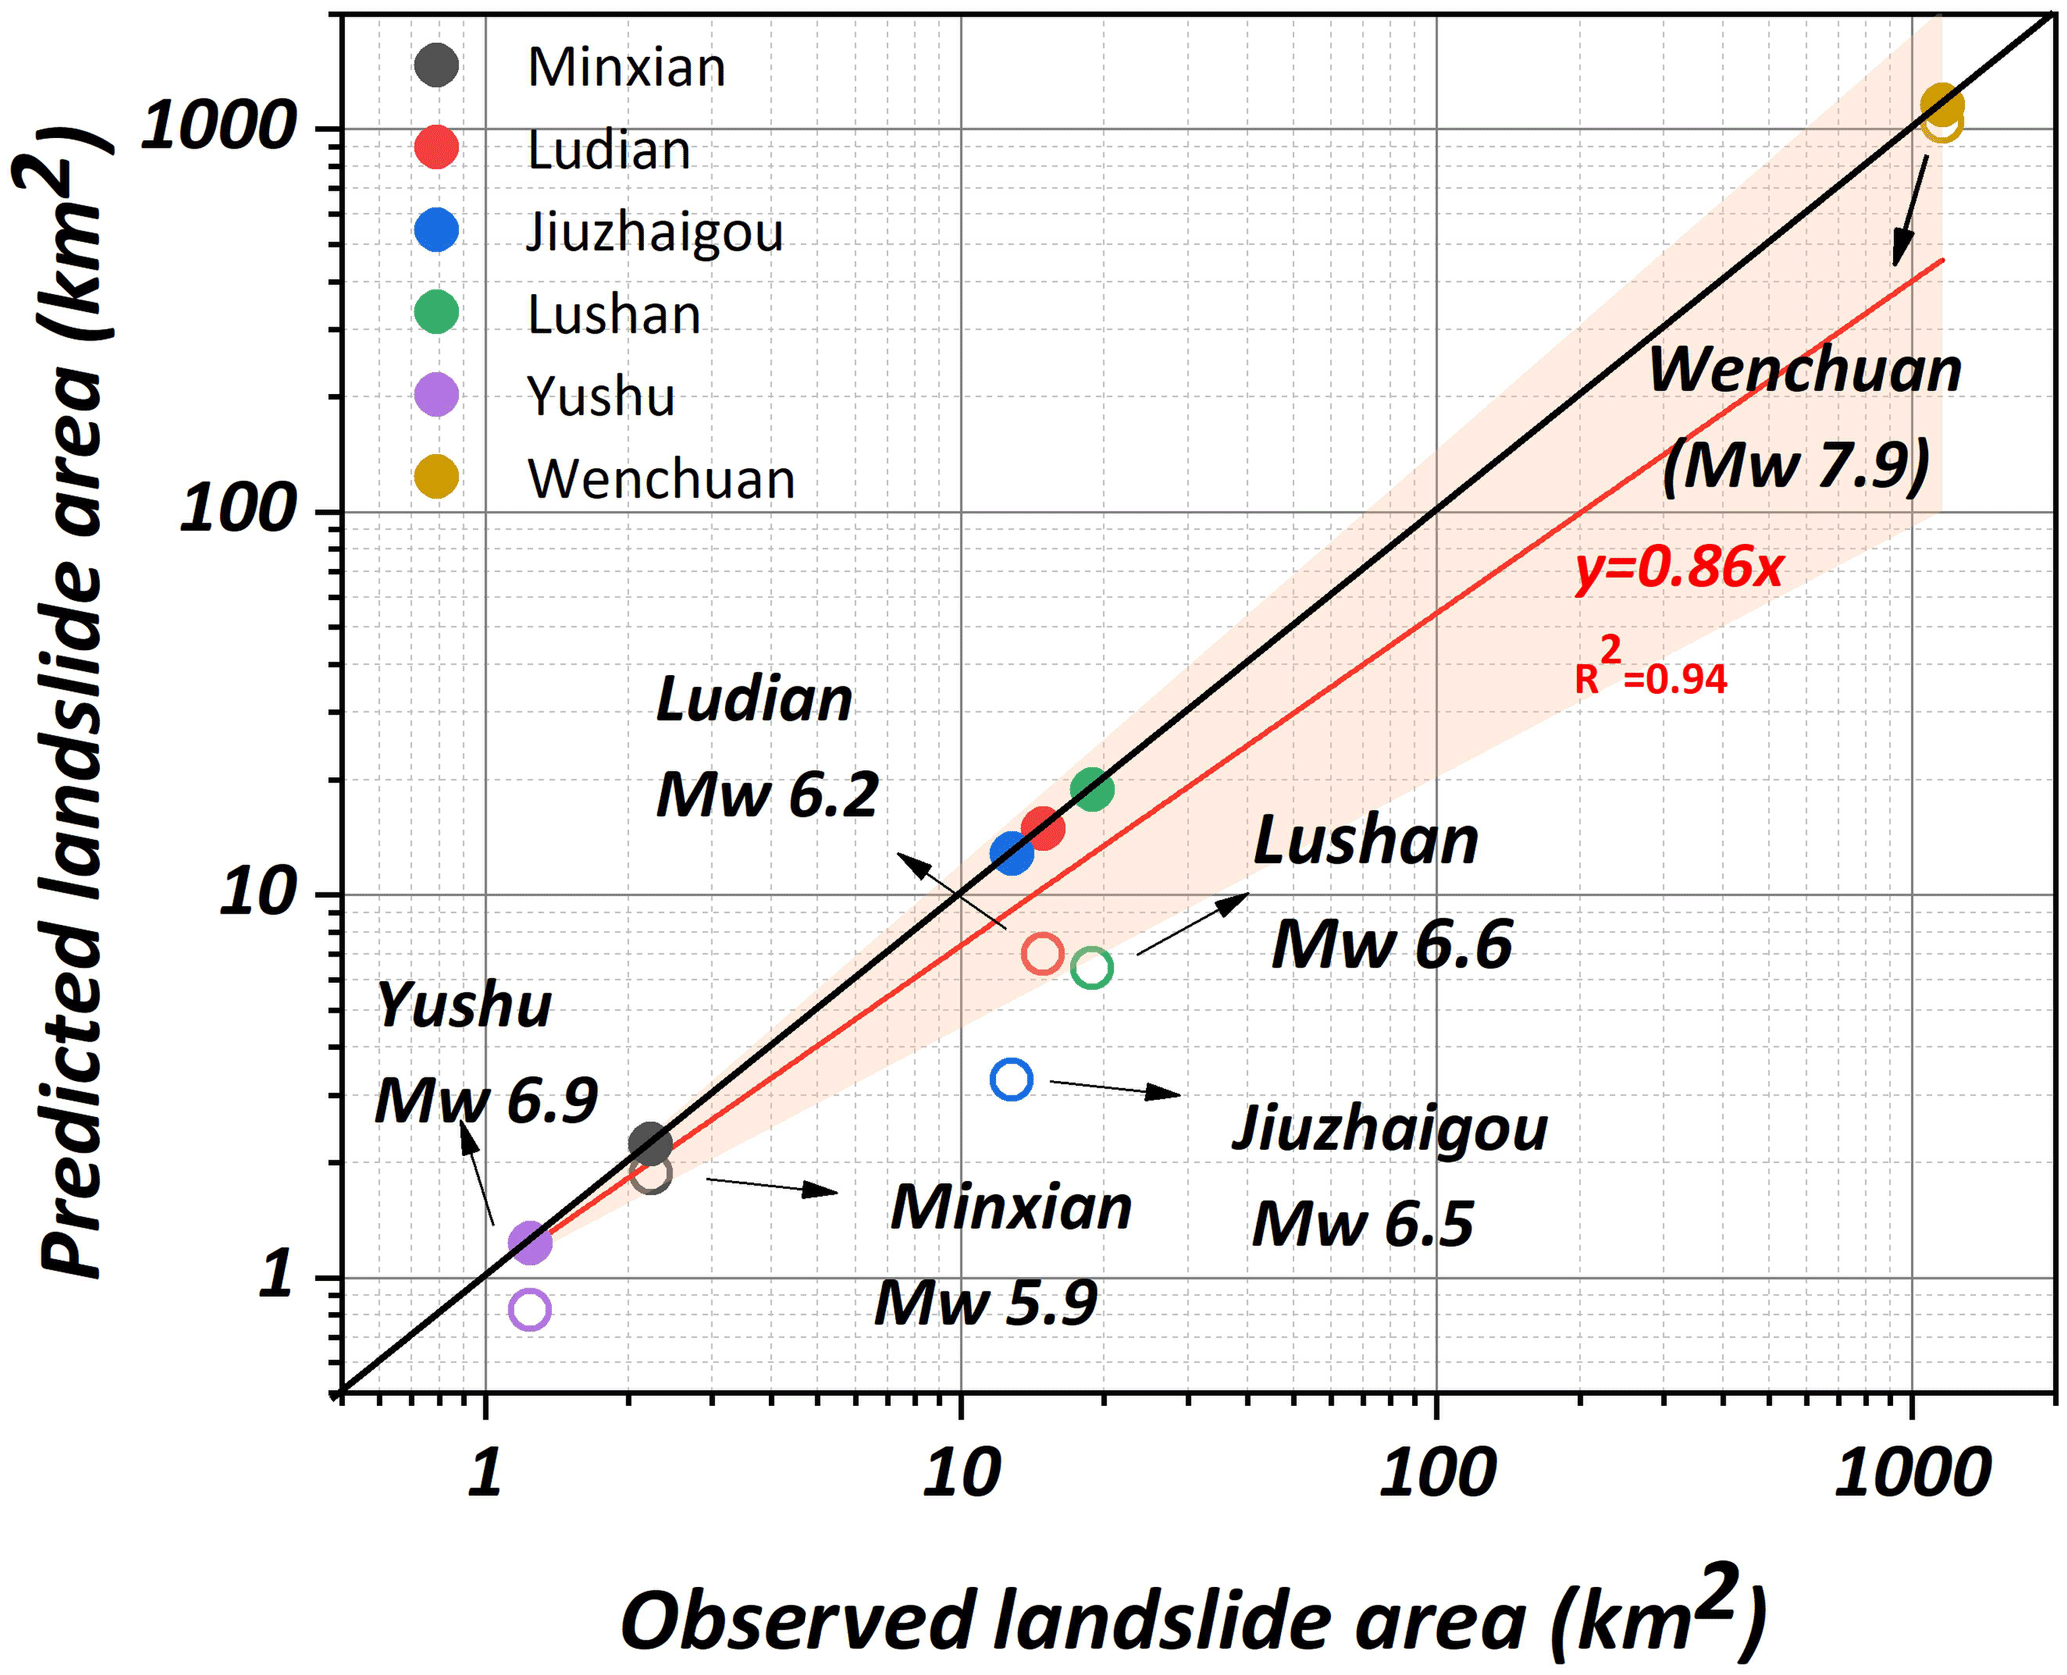
Figure 8Relationships between the observed landslide area (Ao) and the predicted landslide area (Ap) for the six earthquake events in the second and third stages. The unfilled and filled circles represent the predicted landslide area for the second and third stages, respectively. The red and black lines represent the fitting curves of the second and third stages, respectively.
Figure 9 shows the distribution of regression coefficients of various influencing factors in the second and third stages. For continuous variables, if the regression coefficient is positive, with the increase in the independent variable, the probability of landslide occurrence is larger (Shao et al., 2020a; Nowicki Jessee et al., 2019). According to the regression coefficient, we can explain the relationship between each influencing factor and the corresponding landslide occurrence. We choose four independent variables that have large impact on landslide occurrence, namely, the topographic relief, hillslope gradient, seismic intensity, and distance to seismogenic fault. The results show that the regression coefficient of seismic intensity is the largest in all seismic events, followed by that of the hillslope gradient, indicating that the seismic factor and hillslope gradient are the main factors controlling the occurrence of seismic landslides. The distance to fault is another important factor that controls the occurrence of seismic landslides. The regression coefficient of this variable is negative, implying that it has a negative effect on the occurrence of seismic landslides (i.e., the farther away from the seismogenic fault, the less likely the occurrence of seismic landslides). Furthermore, with the exception of the 2010 Yushu earthquake, the regression coefficients of topographic relief in the earthquake events are all positive, indicating that topographic relief in these five other earthquake events plays an essential role in the occurrence of seismic landslides. Figure S1 in the Supplement shows the LR regression coefficients of all the continuous independent variables of the six earthquake events in different stages.
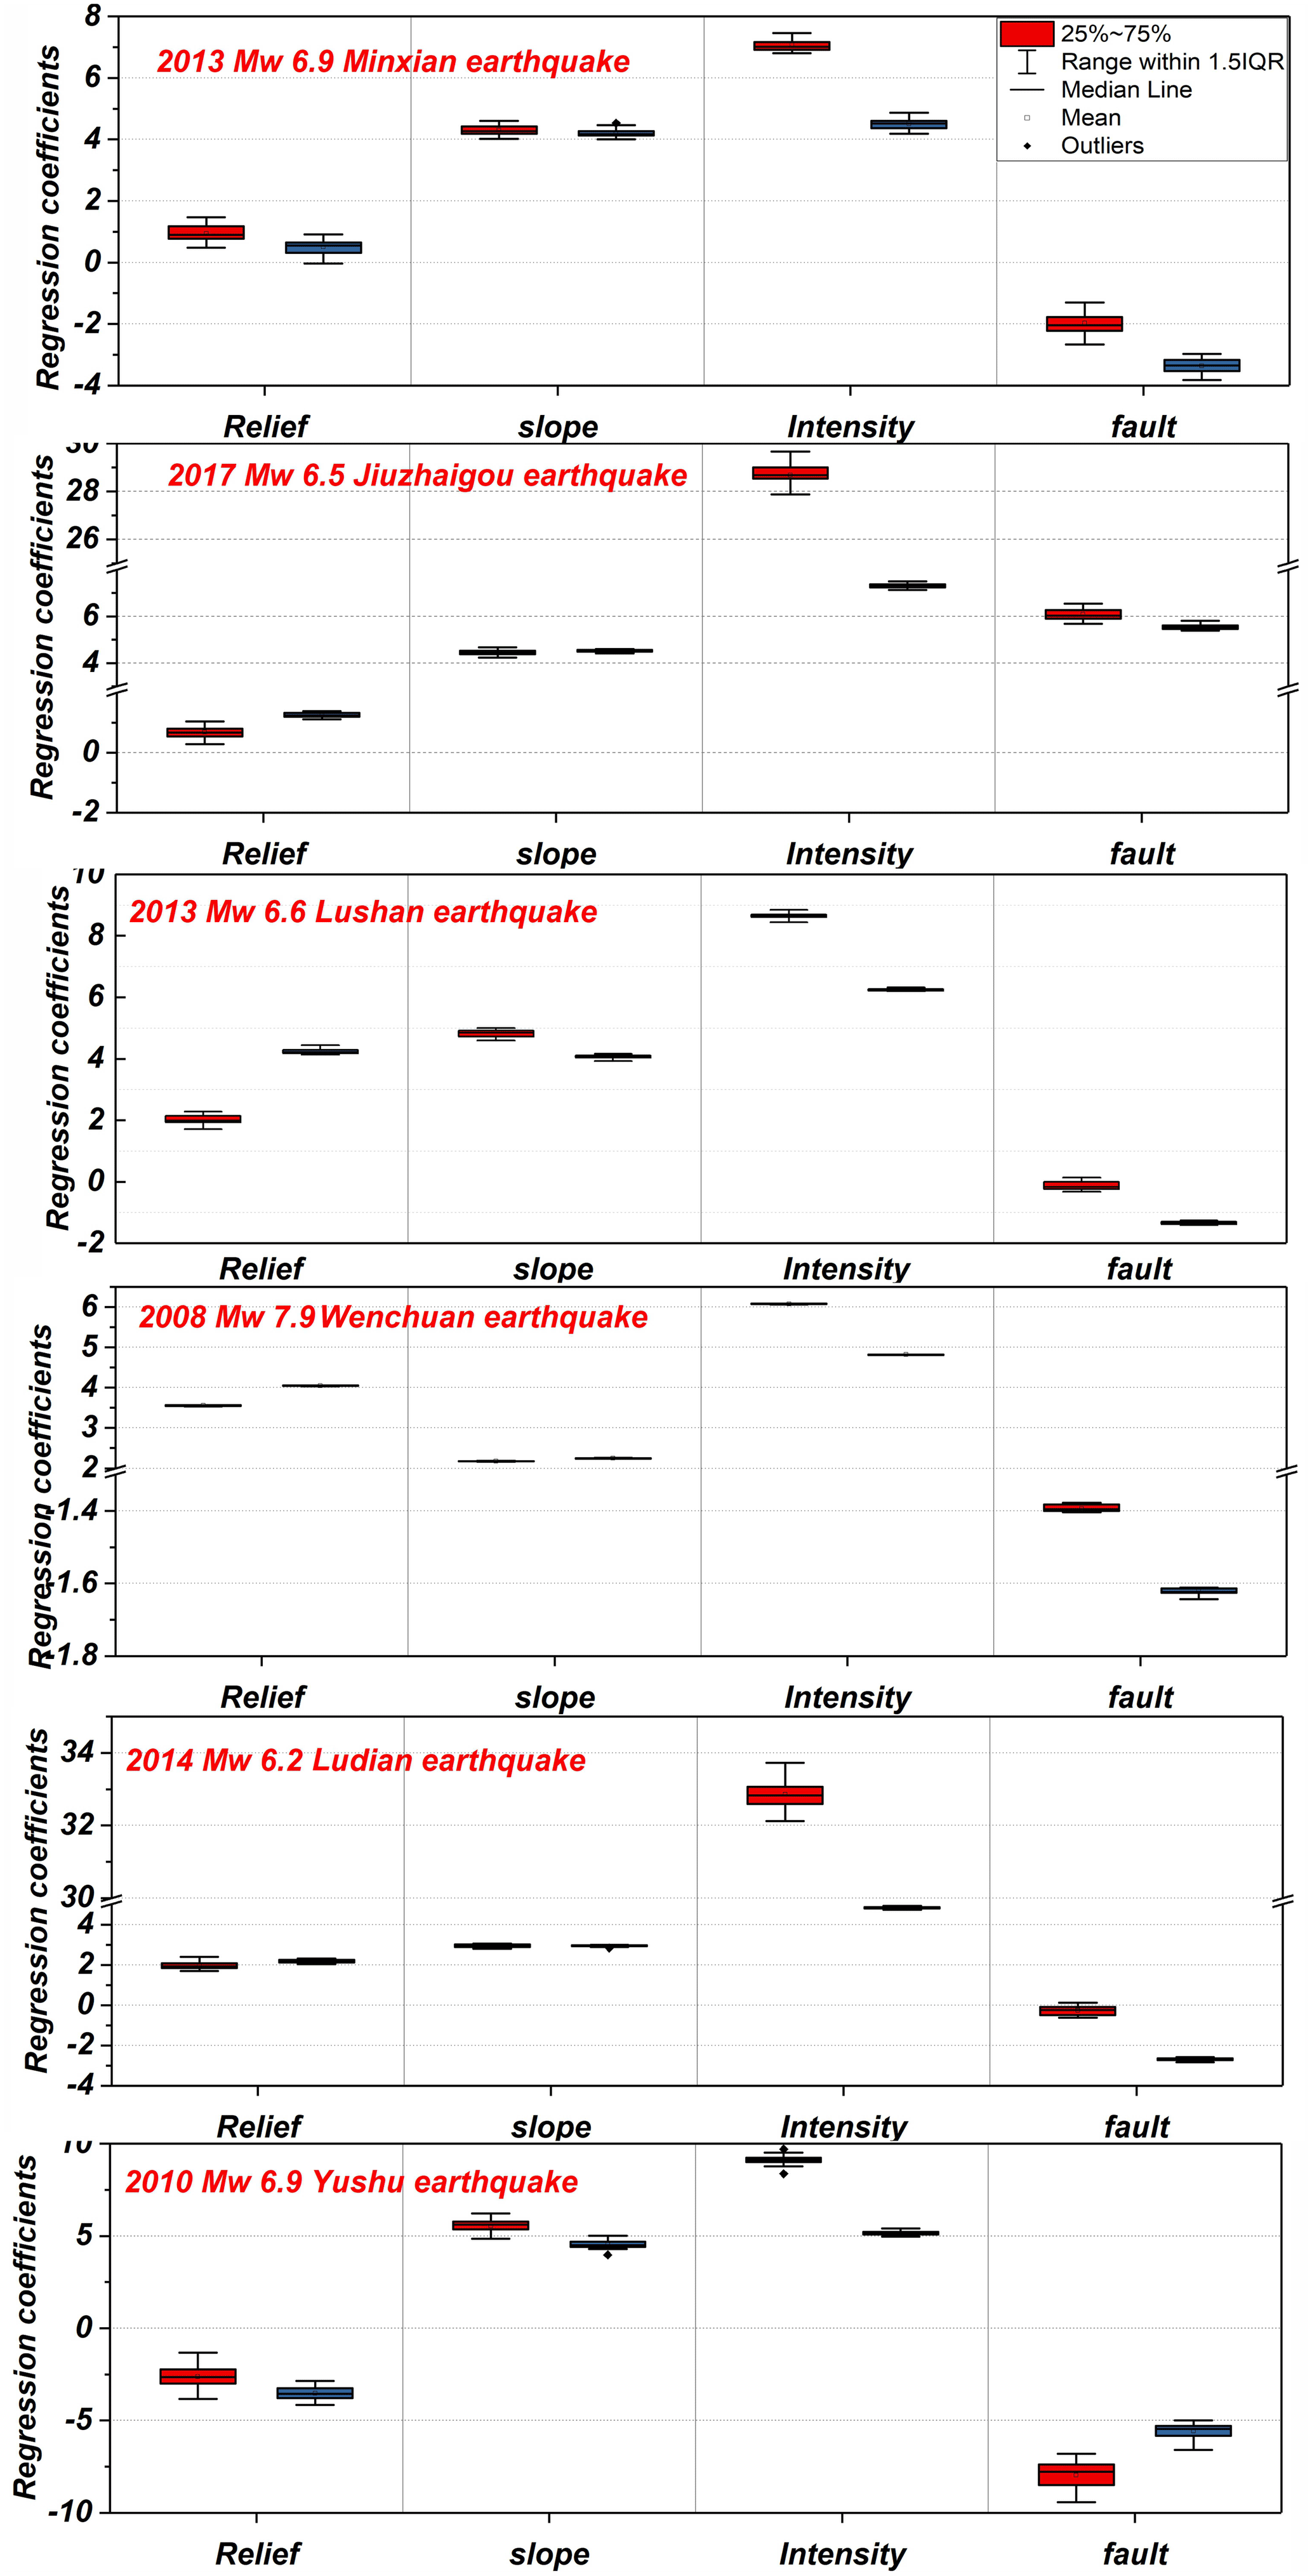
Figure 9Regression coefficients of independent variables at different evaluation stages. The red box represents the regression coefficients of the independent variables in the second stage, and the blue box represents the regression coefficients of the independent variables in the third stage.
4.3 Quantitative analysis
In order to quantitatively analyze the model results of the six earthquakes at different stages, three indexes including the receiver operating characteristic (ROC) curve, the confusion matrix, and the predicted landslide area (Ap) are used. Figure 10 and Table S1 in the Supplement show the predicted landslide area for the six earthquake events in different stages. The results reveal that the Ap of the three events including the Minxian, Ludian, and Jiuzhaigou earthquakes in the first stage is much lower than the corresponding Ao, whereas the Ap of the Lushan, Yushu, and Wenchuan earthquakes is significantly greater. Furthermore, based on incomplete landslide data in the meizoseismal area, Ap is much smaller than Ao. However, when the prediction model of the third stage based on complete landslide data is built, Ap is nearly identical to Ao.
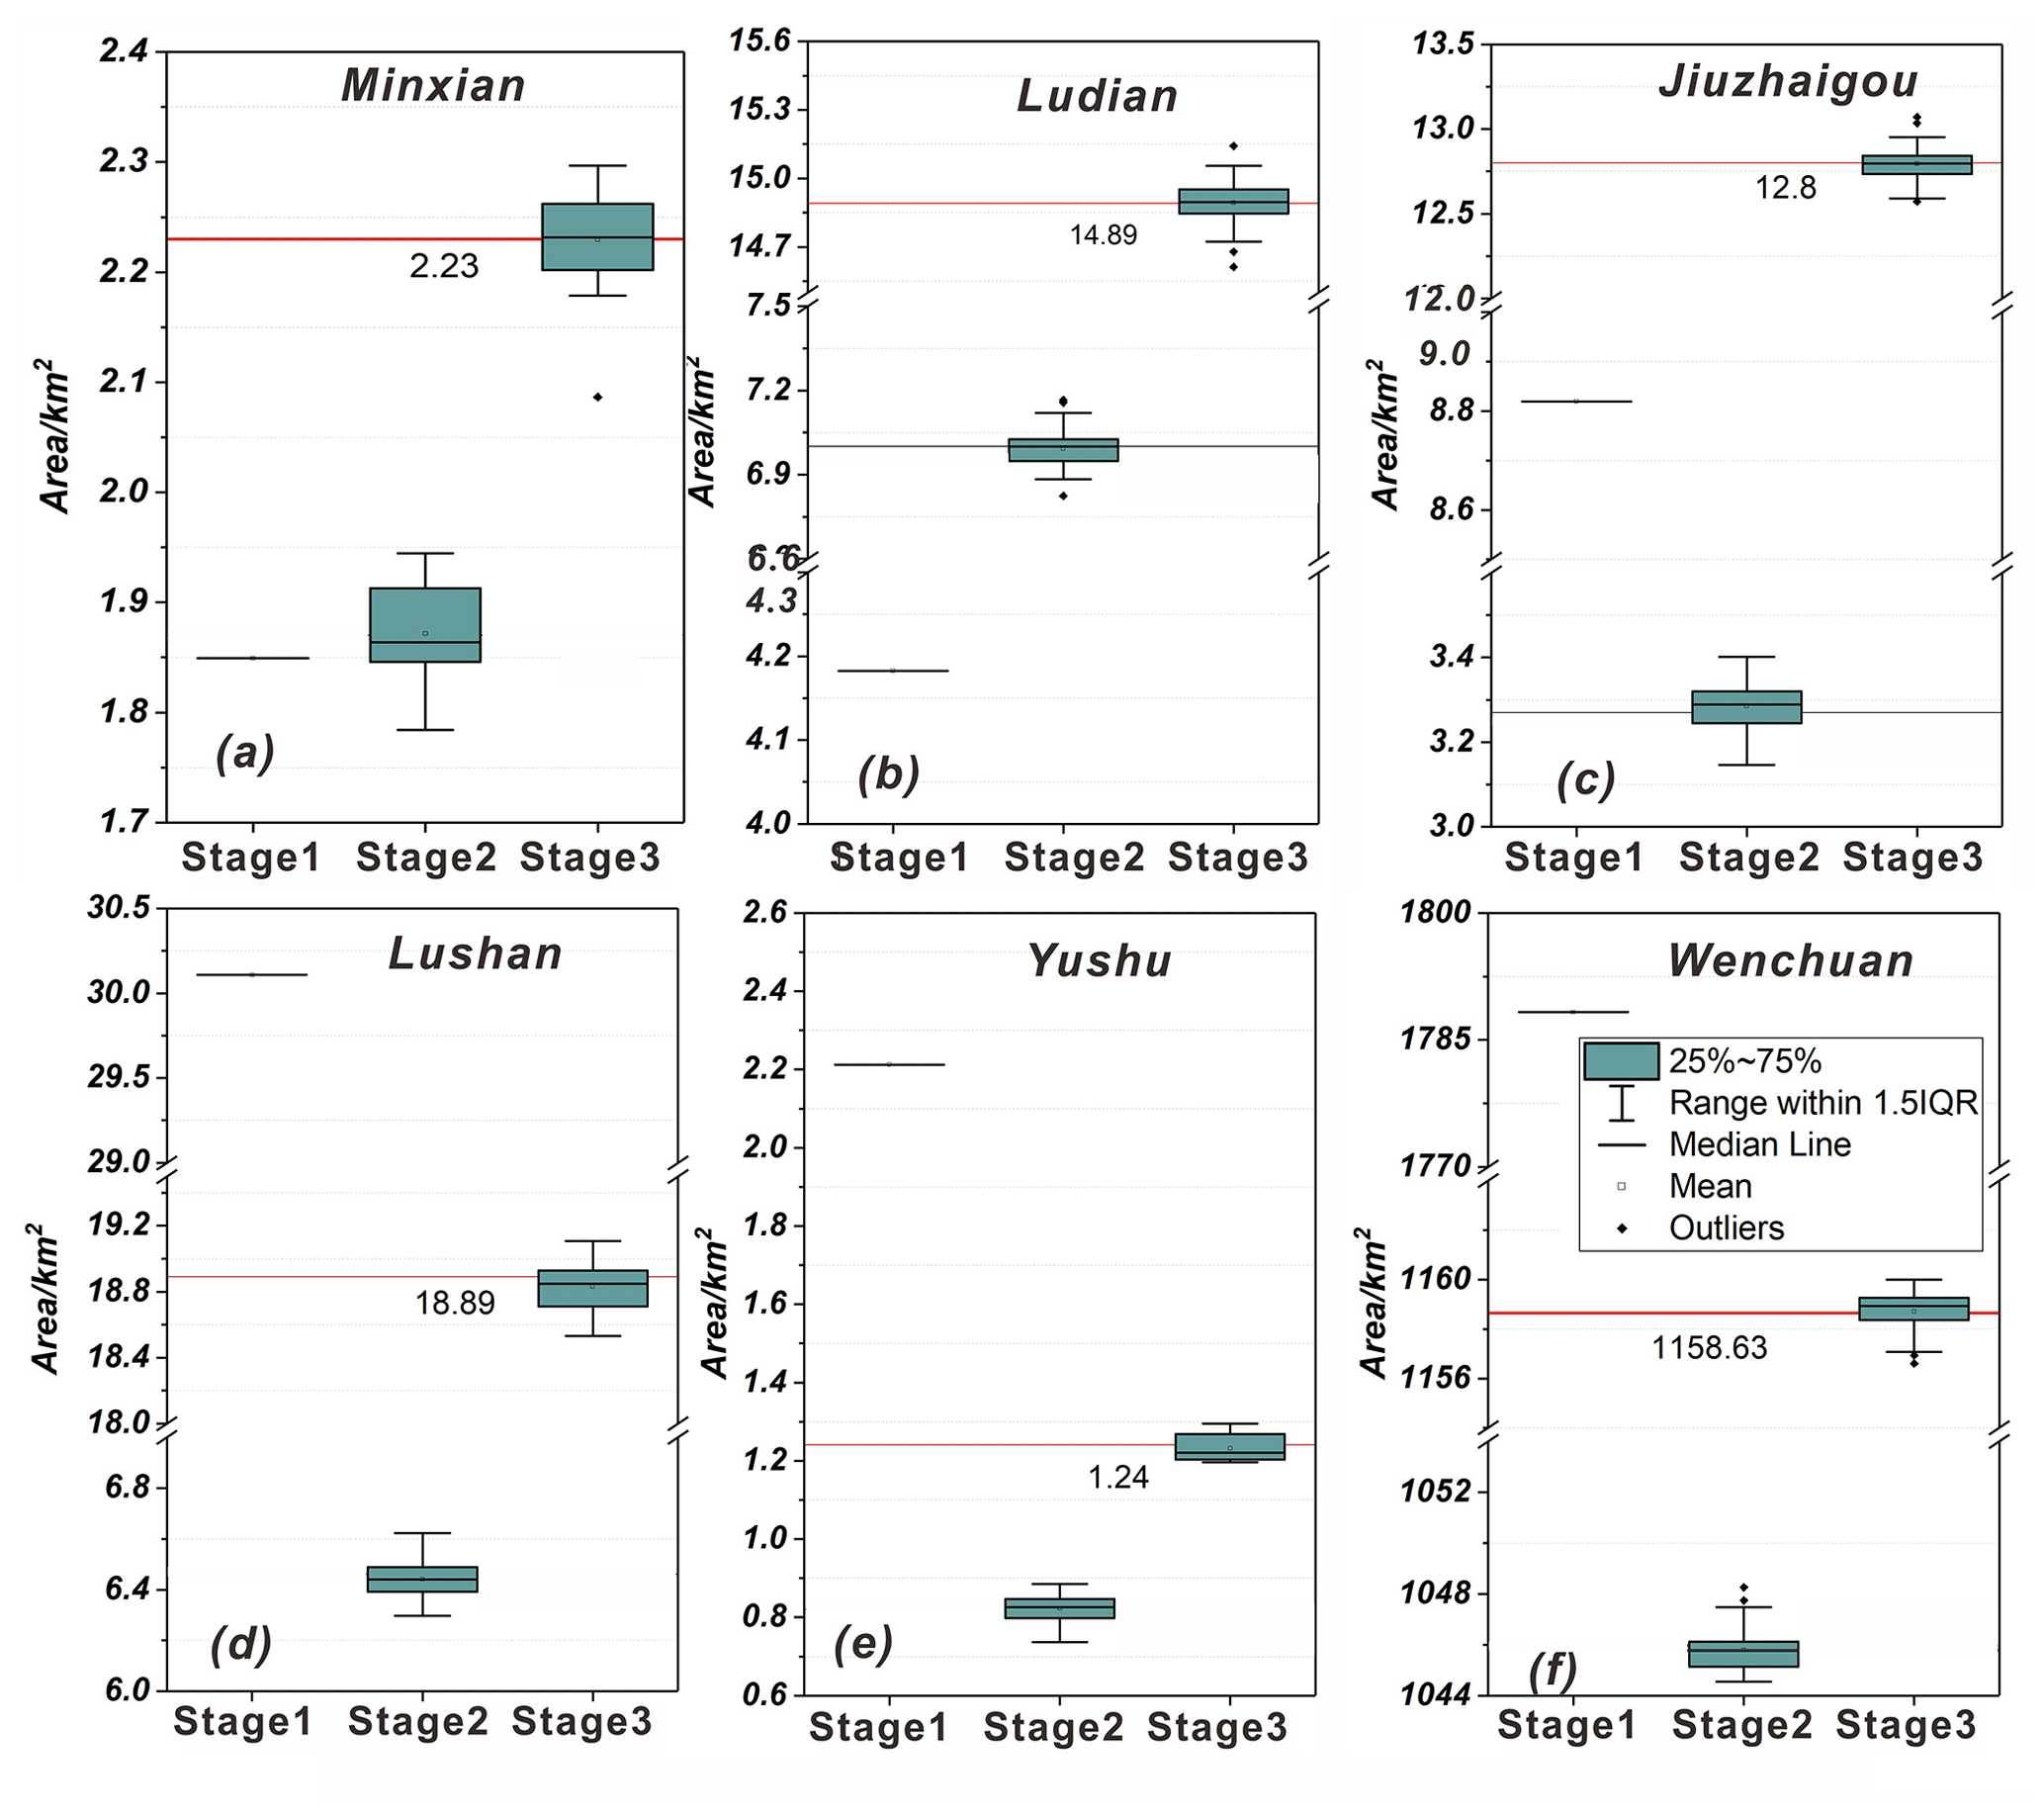
Figure 10Predicted landslide area for the six earthquake events in different evaluation stages. The horizontal line represents the total area of landslides triggered by the earthquake.
In this study, we randomly select 70 % of the total samples for model training, and the remaining 30 % are used for modeling validation. Figure 11 and Table S2 show the distribution of AUC values based on validation samples for the six earthquake events in different stages. The results show that except for the Ludian earthquake, the prediction accuracy of the model outputs for the earthquake events exhibits an upward trend. In the first stage, the AUC value of the modeling performance of the Wenchuan earthquake is the highest, reaching 0.947, while the AUC value of the Minxian earthquake is the lowest, only 0.57. Additionally, the AUC values of the four other earthquakes range from 0.8 to 0.85. In the second and third stages, we can observe that as landslide data quality is continuously improved, the prediction accuracy of the model based on the entire landslide database gradually increases. Based on the entire landslide database, the AUC value of the six events exceeds 0.9, indicating a very high prediction accuracy.
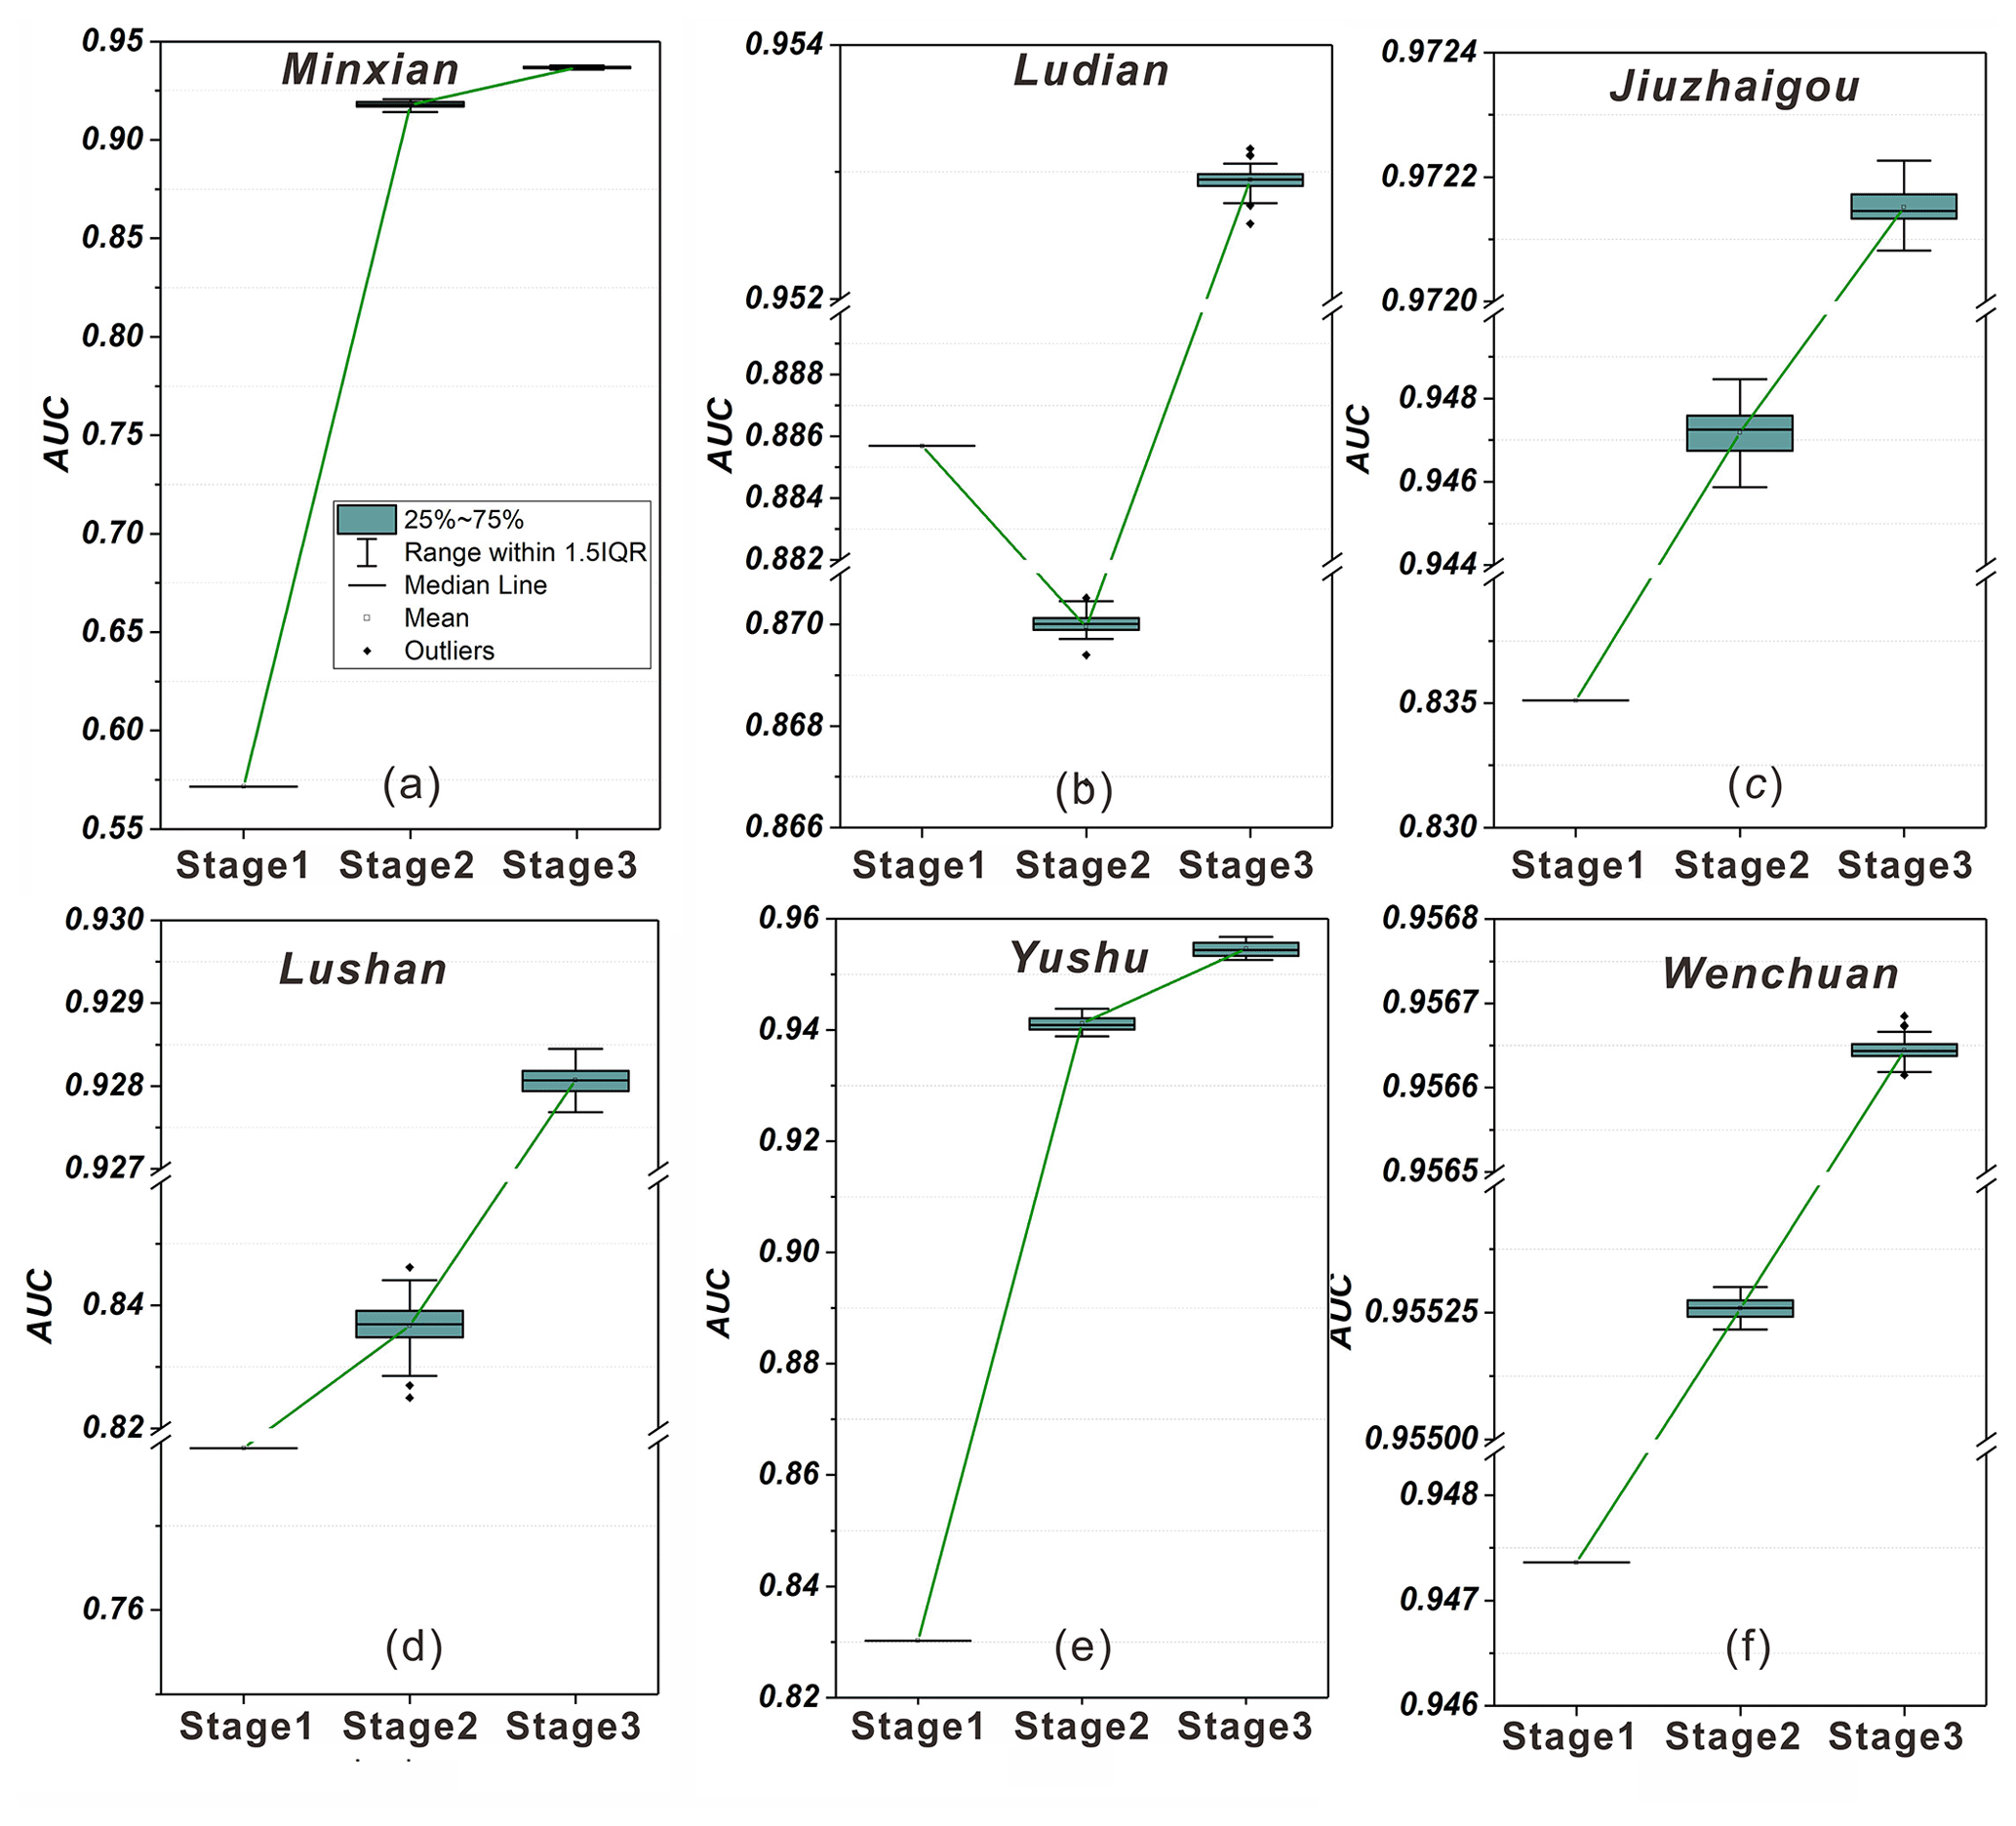
Figure 11Distribution of AUC values for the six earthquake events in different evaluation stages.
Figure 12 and Table S3 show the calculated model accuracy using actual landslide data from the six seismic events at different stages. The accuracy of the model fluctuates from 58 % to 78 % in the first stage, indicating that the model's applicability for different seismic events changes. In the second stage, with the exception of the Wenchuan earthquake, the accuracy of earthquake events is less than 80 %. In the third stage, the model accuracy of all seismic events exceeds 80 %, with the Jiuzhaigou event reaching 91 %.
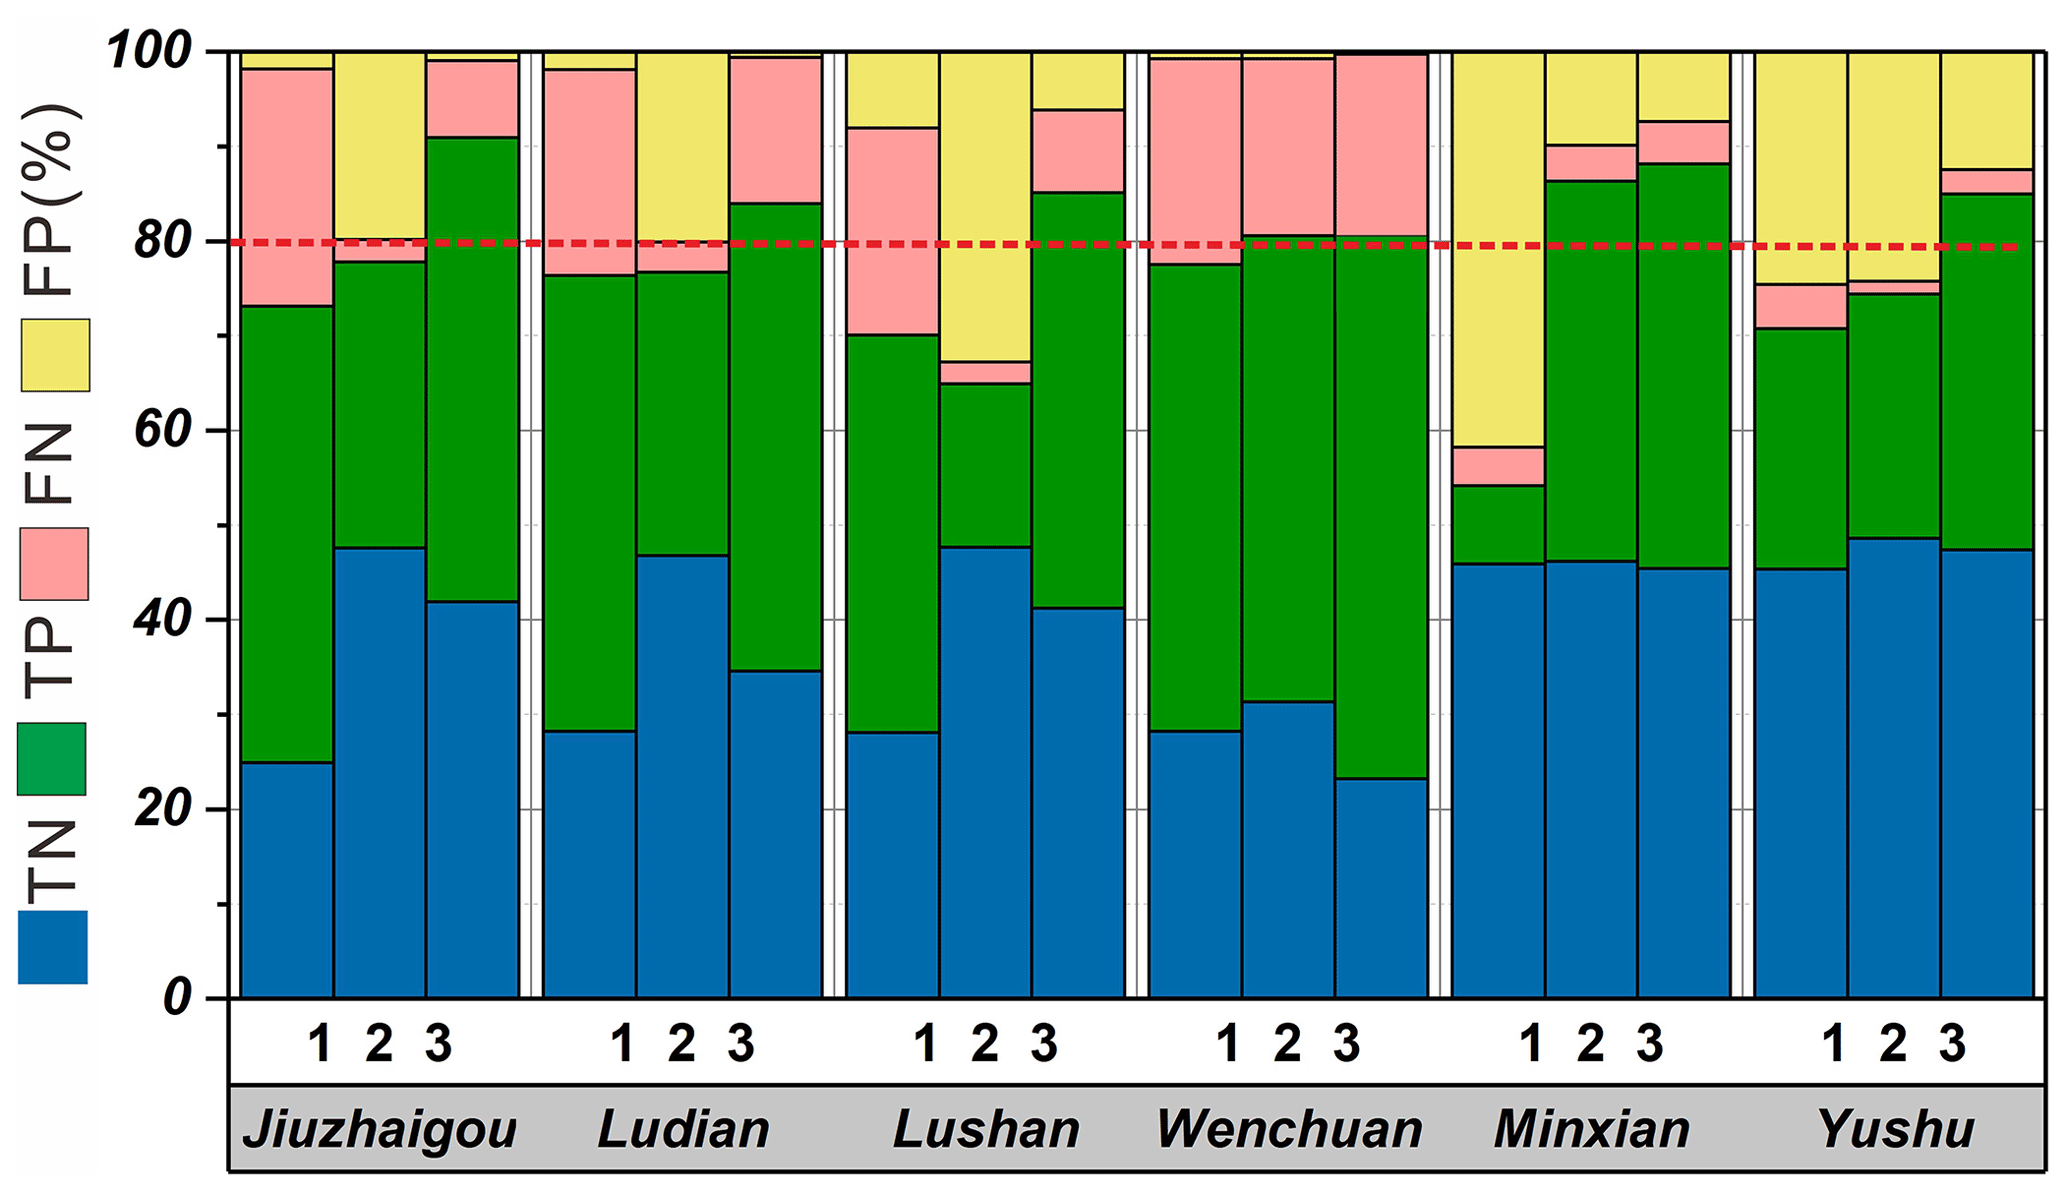
Figure 12Results of models validated by the six earthquake inventories. TN: true negative; TP: true positive; FN: false negative; FP: false positive. The accuracy (ACC) of the models is represented graphically by the sum of the two lower bars.
Time is of the essence in the emergency response stage, stage I. Rapid evaluation of earthquake-induced landslides can quickly determine the high-hazard areas of seismic landslides and provide a basis for optimizing emergency deployment. Although the Newmark model is widely used in the emergency evaluation of earthquake-induced landslides, this method is affected by input parameters and model simplification, resulting in the problem of practicability in the emergency rescue stages (S. Y. Ma and Xu, 2019). In recent years, near-real-time coseismic landslide models based on global landslide data have been proposed and tested in some earthquake cases. Allstadt et al. (2018) compare three global earthquake-induced landslide models and use the 2016 Mw 7.8 Kaikōura, New Zealand, earthquake to evaluate the performance of three models. The seismic landslide hazard assessment map of this earthquake event is created by the abovementioned models and the ShakeMap data published by the USGS, demonstrating the remarkable potential of near-real-time models in earthquake landslide emergency assessment. Similarly, Xu et al. (2019) have established a new generation of the Chinese earthquake-triggered landslide hazard model based on nine real earthquake-triggered landslide cases. We applied this model to the six earthquake events in the Sichuan–Yunnan region, and the result shows that although the prediction result based on this model is the landslide hazard estimate with 100 m resolution, the model can quickly determine the high-hazard area after the earthquake. Furthermore, with the exception of the Minxian earthquake, the model shows strong prediction ability, and the AUC values of the five other events are greater than 0.8 (Fig. 11). However, the AUC value of the Minxian event is only 0.57, illustrating that the model cannot be applied in the Minxian region (Fig. 11).
The main lithology of the landslides triggered by the earthquake in the Minxian region is Pleistocene loess, and thus the main landslide type is small- and medium-sized loess landslide (Xu et al., 2014b). In contrast, the coseismic landslides triggered by the five other events are primarily rock landslides. Furthermore, the landform of the Minxian area is typical loess landform with thick loess covering the hillside. The remaining five earthquake zones are typical mountainous landforms with high altitudes and steep slopes, and their rock joints are well developed due to the strong influence of tectonic activity. Therefore, the Minxian earthquake took place in extremely different geological, topographic, and geomorphic conditions compared with other five earthquake events. Such differences lead to the poor evaluation ability of the model for the Minxian earthquake. Otherwise, the AUC value of the Wenchuan earthquake is the highest, reaching 0.947 (Fig. 11). The Chinese earthquake-triggered landslide hazard model includes more than 300 000 real landslide records, of which the landslide records of the Wenchuan earthquake account for more than 60 % of the total records. Because of the relatively large number of landslides triggered by the Wenchuan event, the global data set remains dominated by this earthquake. The construction of the LR model is most affected by the landslide samples of the Wenchuan events, which leads to the highest applicability and accuracy of the model in the Wenchuan region. The same phenomenon can also be found in previous studies (Nowicki et al., 2014; Nowicki Jessee et al., 2019).
In the first stage, we have to admit that the evaluation results of the six earthquakes based on the Xu2019 model have still to be improved. It is clear that landslide observations from the earthquake match well with the predicted high probabilities, but the model predicts potential landslides in a large area beyond the mapped landslide area. Especially in the Minxian, Jiuzhaigou, and Yushu earthquake cases, the performance of the model is not satisfactory (Fig. 4). Most of the current near-real-time models have similar problems in that the model performs well when evaluated over the domain of an entire event area, but clearly, individual pixels will predict probabilities that underestimate or overestimate the landslide hazard (Nowicki Jessee et al., 2019). We propose two possible reasons for this phenomenon: (1) the resolution of the input data of the Xu2019 model is 100 m, which affects the prediction accuracy of the model to a certain extent. Therefore, there may be errors between the modeling prediction and the actual result at the regional scale. (2) The nine earthquake cases used for the establishment of the Xu2019 model are located in China and its adjacent areas. The corresponding epicentral areas have different topographic and geological conditions, and only four cases are in the Sichuan–Yunnan area, which may weaken the applicability of the Xu2019 model in other quake events. Therefore, in the past few years, we have been constantly supplementing the earthquake landslide database in the Sichuan–Yunnan region (e.g., with the 2014 Ms 6.6 Jinggu earthquake, 2020 Ms 5.0 Qiaojia earthquake, 2018 Ms 5.7 Xingwen earthquake, 2019 Ms 6.0 Changning earthquake, and 2022 Ms 6.8 Luding earthquake). We suggest that with the accumulation of enough coseismic landslide inventories in the Sichuan–Yunnan area, we can continue to update the near-real-time earthquake-triggered landslide hazard model based on these abundant landslide data and high-resolution input factor data, further improving the accuracy of the modeling in the emergency assessment stage.
Considering the fact that remote sensing and GIS technology have advanced significantly in recent years, a considerable number of post-earthquake images may appear within a few hours or days of the earthquake. However, due to the broad quake-affected area, cloud coverage, satellite scheduling, and other factors, it is difficult to acquire the post-quake optical imagery immediately (Roback et al., 2018; Kargel et al., 2016). Therefore, in the temporary resettlement stage, stage II, we can only obtain the images of the meizoseismal area and must carry out visual interpretation or automatic identification of the seismic landslides in this area. Robinson et al. (2017) use the coseismic landslide database of the 2016 Nepal earthquake to conduct the rapid post-earthquake modeling of coseismic landslides. The evaluation results obtained by randomly selecting a small number of landslide samples are not much different from those obtained based on the complete landslide database, indicating that incomplete landslide samples can also be used to conduct seismic landslide hazard assessments. Our findings also reveal that the AUC values of all seismic events in the second stage are greater than 0.8, demonstrating that the prediction results based on incomplete landslide data in the meizoseismal area can better predict the location of the landslides in the entire earthquake area (Figs. 11 and 12). Although the Ap calculated by incomplete landslide data is slightly less than the Ao triggered by earthquake events (Fig. 10), the prediction model generally has a certain applicability in the mid-term stage of the earthquakes, which can better take into account timeliness and accuracy and thus more effectively serve a role in post-disaster resettlement in earthquake-stricken areas (Ma et al., 2020).
The aim of this study is to propose an improved three-stage spatial prediction strategy and evaluate its applicability in six earthquake events. The results reveal that in the first stage, the AUC value of the modeling performance of the Wenchuan earthquake is the highest, reaching 0.947, while the AUC value of the Minxian earthquake is the lowest, only 0.57. In the second and third stages, we can observe that as landslide data are continuously improved, the prediction ability of the model based on the entire landslide database is gradually enhanced. Based on the entire landslide database, the AUC values of the six events exceed 0.9, indicating a very high prediction accuracy. Furthermore, the Ap for the six earthquake events in different evaluation stages shows that based on incomplete landslide data in the meizoseismal area, it is much smaller than Ao. Nevertheless, when the prediction model based on complete landslide data is built, Ap is nearly identical to Ao. Overall, the prediction results in the first stage can meet the requirements of emergency rescue by quickly obtaining the overall predicted information of the possible coseismic landslide locations in the quake-affected area. With the improvement of the coseismic landslide data in the second and third stages, the accuracy of the prediction results can improve, and thus the model can meet the requirements of temporary restoration and later reconstruction. This improved three-stage spatial prediction strategy has preferable practicability for regional landslide prevention and the mitigation of the effects of major earthquakes in the Sichuan and Yunnan regions.
Mat.LShazard V1.0 is composed of three modules including data input, model training, and model validation coded as separate MATLAB script files and can be executed under Windows operating systems with the MATLAB 2016 version or higher. Mat.LShazard V1.0 is free software, and the codes are all public. The codes can be made available by the corresponding author upon request.
Data used in this study include mapped landslide inventories of the 2008 Mw 7.9 Wenchuan earthquake (Xu et al., 2014b), the 2014 Mw 6.6 Ludian earthquake (Wu et al., 2020), the 2013 Mw 6.6 Lushan earthquake (Xu et al., 2015), the 2017 Mw 6.5 Jiuzhaigou earthquake (Tian et al., 2019), the 2013 Mw 5.9 Minxian earthquake (Tian et al., 2016), and the 2010 Mw 6.9 Yushu earthquake (Xu and Xu, 2014). A subset of these landslide inventories is publicly available in an open-access data repository from https://www.sciencebase.gov/catalog/item/586d824ce4b0f5ce109fc9a6 (U.S. Geological Survey (USGS), 2017). The elevation data are from the 30 m resolution SRTM DEM (Jarvis et al., 2008). The distribution of seismic intensity for every seismic event is provided by the China Earthquake Networks Center (2022, https://www.cenc.ac.cn/cenc/zgdztw/index.html). Lithology data are from the China Geological Survey (2021, http://dcc.cgs.gov.cn/).
The supplement related to this article is available online at: https://doi.org/10.5194/gmd-16-5113-2023-supplement.
CX conceptualized the work and designed the overall methodology. XS wrote the codes of Mat.LShazard and original draft of the paper. SM designed the framework of this research, processed the relevant data, and performed the overall Mat.LShazard code validation. SM and CX contributed to the review, editing, and writing of the paper.
The contact author has declared that none of the authors has any competing interests.
Publisher's note: Copernicus Publications remains neutral with regard to jurisdictional claims in published maps and institutional affiliations.
The authors thank Ali P. Yunus and the anonymous reviewers for their constructive suggestions, which were of great significance to improving the quality of this paper.
This research has been supported by the National Institute of Natural Hazards, Ministry of Emergency Management of China (ZDJ2021-14), and the Lhasa National Geophysical Observation and Research Station (NORSLS20-07).
This paper was edited by Mauro Cacace and reviewed by Ali P. Yunus and two anonymous referees.
Allstadt, K. E., Jibson, R. W., Thompson, E. M., Massey, C. I., Wald, D. J., Godt, J. W., and Rengers, F. K.: Improving near-real-time coseismic landslide models: Lessons learned from the 2016 Kaikōura, New Zealand, Earthquake, B. Seismol. Soc. Am., 108, 1649–1664, https://doi.org/10.1785/0120170297, 2018.
Bai, S. B., Lu, P., and Wang, J.: Landslide susceptibility assessment of the Youfang Catchment using logistic regression, J. Mt. Sci., 816–827, https://doi.org/10.1007/s11629-014-3171-5, 2015.
Bragagnolo, L., da Silva, R. V., and Grzybowski, J. M. V.: Landslide susceptibility mapping with r.landslide: A free open-source GIS-integrated tool based on Artificial Neural Networks, Environ. Modell. Softw., 123, 104565, https://doi.org/10.1016/j.envsoft.2019.104565, 2020.
Brenning, A.: Spatial prediction models for landslide hazards: review, comparison and evaluation, Nat. Hazards Earth Syst. Sci., 5, 853–862, https://doi.org/10.5194/nhess-5-853-2005, 2005.
Broeckx, J., Vanmaercke, M., Duchateau, R., and Poesen, J.: A data-based landslide susceptibility map of Africa, Earth-Sci. Rev., 185, 102–121, https://doi.org/10.1016/j.earscirev.2018.05.002, 2018.
Cao, J., Zhang, Z., Wang, C., Liu, J., and Zhang, L.: Susceptibility assessment of landslides triggered by earthquakes in the Western Sichuan Plateau, Catena, 175, 63–76, https://doi.org/10.1016/j.catena.2018.12.013, 2019.
Chen, L., Wang, H., Ran, Y., Sun, X., Su, G., Wang, J., Tan, X., Li, Z., and Zhang, X.: The MS7.1 Yushu earthquake surface rupture and large historical earthquakes on the Garzê-Yushu Fault, Chinese Sci. Bull., 55, 3504–3509, https://doi.org/10.1007/s11434-010-4079-2, 2010.
Cheng, J., Xu, X., and Chen, G.: A new prediction model of seismic hazard for the Sichuan-Yunnan region based on the occurrence rate of large earthquakes, Chinese J. Geophys.-Ch., 63, 1170–1182, https://doi.org/10.6038/cjg2020N0204, 2020.
China Earthquake Networks Center: The distribution of seismic intensity, https://www.cenc.ac.cn/cenc/zgdztw/index.html, last access: 4 August 2022.
China Geological Survey: 1: 250000 geological map, http://dcc.cgs.gov.cn/ last access: 5 August 2021.
Cui, P., Zhu, Y.-Y., Han, Y.-S., Chen, X.-Q., and Zhuang, J.-Q.: The 12 May Wenchuan earthquake-induced landslide lakes: distribution and preliminary risk evaluation, Landslides, 6, 209–223, https://doi.org/10.1007/s10346-009-0160-9, 2009.
Dai, F., Lee, C. F., Li, J., and Xu, Z. W.: Assessment of landslide susceptibility on the natural terrain of Lantau Island, Hong Kong, Environ. Geol., 40, 381–391, https://doi.org/10.1007/s002540000163, 2001.
Dai, F. C. and Lee, C. F.: Landslide characteristics and slope instability modeling using GIS, Lantau Island, Hong Kong, Geomorphology, 42, 213–228, https://doi.org/10.1016/S0169-555X(01)00087-3, 2002.
Demir, G., Aytekin, M., Akgün, A., İkizler, S. B., and Tatar, O.: A comparison of landslide susceptibility mapping of the eastern part of the North Anatolian Fault Zone (Turkey) by likelihood-frequency ratio and analytic hierarchy process methods, Nat. Hazards, 65, 1481–1506, https://doi.org/10.1007/s11069-012-0418-8, 2013.
Dreyfus, D. K., Rathje, E. M., and Jibson, R. W.: The influence of different simplified sliding-block models and input parameters on regional predictions of seismic landslides triggered by the Northridge earthquake, Eng. Geol., 163, 41–54, https://doi.org/10.1016/j.enggeo.2013.05.015, 2013.
Ercanoglu, M. and Temiz, F. A.: Application of logistic regression and fuzzy operators to landslide susceptibility assessment in Azdavay (Kastamonu, Turkey), Environ. Earth Sci., 64, 949–964, https://doi.org/10.1007/s12665-011-0912-4, 2011.
Fawcett, T.: An introduction to ROC analysis, Pattern. Recogn. Lett., 27, 861–874, https://doi.org/10.1016/j.patrec.2005.10.010, 2006.
Fick, S. E. and Hijmans, R. J.: WorldClim 2: new 1-km spatial resolution climate surfaces for global land areas, Int. J. Climatol., 37, 4302–4315, https://doi.org/10.1002/joc.5086, 2017.
Guzzetti, F., Paola, R., Cardinali, M., Galli, M., and Ardizzone, F.: Probablistic landslide hazard assessment at the basin scale, Geomorphology, 72, 272–299, https://doi.org/10.1016/j.geomorph.2005.06.002, 2005.
He, Q., Wang, M., and Liu, K.: Rapidly assessing earthquake-induced landslide susceptibility on a global scale using random forest, Geomorphology, 391, 107889, https://doi.org/10.1016/j.geomorph.2021.107889, 2021.
Huang, R. and Fan, X.: The landslide story, Nat. Geosci., 6, 325–326, https://doi.org/10.1038/ngeo1806, 2013.
Jarvis, A., Reuter, H., Nelson, A., and Guevara, E.: Hole-filled seamless SRTM data v4, International Centre for Tropical Agriculture (CIAT), http://srtm.csi.cgiar.org (last access: 4 June 2022), 2008.
Jenness, J., Brost, B., and Beier, P.: Land facet corridor designer: Topographic position index, http://www.jennessent.com (last access: 6 August 2022), 2013.
Jiang, W., Zhang, J., Tian, T., and Wang, X.: Crustal structure of Chuan-Dian region derived from gravity data and its tectonic implications, Phys. Earth. Planet. In., 212–213, 76–87, https://doi.org/10.1016/j.pepi.2012.07.001, 2012.
Jibson, R. W., Harp, E. L., and Michael, J. A.: A method for producing digital probabilistic seismic landslide hazard maps: An example from the Los Angeles, California, area, Eng. Geol., 58, 271–289, https://doi.org/10.1016/S0013-7952(00)00039-9, 2000.
Kargel, J. S., Leonard, G. J., Shugar, D. H., Haritashya, U. K., Bevington, A., Fielding, E. J., Fujita, K., Geertsema, M., Miles, E. S., Steiner, J., Anderson, E., Bajracharya, S., Bawden, G. W., Breashears, D. F., Byers, A., Collins, B., Dhital, M. R., Donnellan, A., Evans, T. L., Geai, M. L., Glasscoe, M. T., Green, D., Gurung, D. R., Heijenk, R., Hilborn, A., Hudnut, K., Huyck, C., Immerzeel, W. W., Liming, J., Jibson, R., Kääb, A., Khanal, N. R., Kirschbaum, D., Kraaijenbrink, P. D. A., Lamsal, D., Shiyin, L., Mingyang, L., McKinney, D., Nahirnick, N. K., Zhuotong, N., Ojha, S., Olsenholler, J., Painter, T. H., Pleasants, M., Pratima, K. C., Yuan, Q. I., Raup, B. H., Regmi, D., Rounce, D. R., Sakai, A., Donghui, S., Shea, J. M., Shrestha, A. B., Shukla, A., Stumm, D., van der Kooij, M., Voss, K., Xin, W., Weihs, B., Wolfe, D., Lizong, W., Xiaojun, Y., Yoder, M. R., and Young, N.: Geomorphic and geologic controls of geohazards induced by Nepal's 2015 Gorkha earthquake, Science, 351, aac8353, https://doi.org/10.1126/science.aac8353, 2016.
Kritikos, T., Robinson, T. R., and Davies, T. R. H.: Regional coseismic landslide hazard assessment without historical landslide inventories: A new approach, J. Geophys. Res-Earth., 120, 711–729, https://doi.org/10.1002/2014JF003224, 2015.
Lan, H., Tian, N., Li, L., Liu, H., Peng, J., Cui, P., Zhou, C., Macciotta, R., and Clague, J. J.: Poverty control policy may affect the transition of geological disaster risk in China, Hum. Soc. Sci. Commun., 9, 80, https://doi.org/10.1057/s41599-022-01096-6, 2022.
Lari, S., Frattini, P., and Crosta, G. B.: A probabilistic approach for landslide hazard analysis, Eng. Geol., 182, 3–14, https://doi.org/10.1016/j.enggeo.2014.07.015, 2014.
Lin, L., Lin, Q., and Wang, Y.: Landslide susceptibility mapping on a global scale using the method of logistic regression, Nat. Hazards Earth Syst. Sci., 17, 1411–1424, https://doi.org/10.5194/nhess-17-1411-2017, 2017.
Liu, J., Wang, T., Shi, J., and Li, Z.: Emergency Rapid Assessment of Landslides Induced by the Jiuzhaigou Ms 7.0 earthquake, Sichuan, China, Journal of Geomechanics, 23, 639–645, 10.16030/j.cnki.issn.1000-3665.202209057, 2017 (in Chinese).
Ma, S. and Xu, C.: Applicability of Two Newmark Models in the Assessment of Coseismic Landslide Hazard and Estimation of Slope-Failure Probability: An Example of the 2008 Wenchuan Mw 7.9 Earthquake Affected Area, J. Earth Sci., 30, 1020–1030, https://doi.org/10.1007/s12583-019-0874-0, 2019.
Ma, S., Xu, C., and Shao, X.: Spatial prediction strategy for landslides triggered by large earthquakes oriented to emergency response, mid-term resettlement and later reconstruction, Int. J. Disast. Risk Re., 43, 101362, https://doi.org/10.1016/j.ijdrr.2019.101362, 2020.
Ma, S. Y. and Xu, C.: Assessment of co-seismic landslide hazard using the Newmark model and statistical analyses: a case study of the 2013 Lushan, China, Mw6.6 earthquake, Nat. Hazards, 96, 389–412, https://doi.org/10.1007/s11069-018-3548-9, 2019.
Massey, C., Townsend, D., Rathje, E., Allstadt, K. E., Lukovic, B., Kaneko, Y., Bradley, B., Wartman, J., Jibson, R. W., Petley, D. N., Horspool, N., Hamling, I., Carey, J., Cox, S., Davidson, J., Dellow, S., Godt, J. W., Holden, C., Jones, K., Kaiser, A., Little, M., Lyndsell, B., McColl, S., Morgenstern, R., Rengers, F. K., Rhoades, D., Rosser, B., Strong, D., Singeisen, C., and Villeneuve, M.: Landslides Triggered by the 14 November 2016 Mw 7.8 Kaikōura Earthquake, New Zealand, B. Seismol. Soc. Am., 108, 1630–1648, https://doi.org/10.1785/0120170305, 2018.
Merghadi, A., Yunus, A. P., Dou, J., Whiteley, J., ThaiPham, B., Bui, D. T., Avtar, R., and Abderrahmane, B.: Machine learning methods for landslide susceptibility studies: A comparative overview of algorithm performance, Earth-Sci. Rev., 207, 103225, https://doi.org/10.1016/j.earscirev.2020.103225, 2020.
Nowicki Jessee, M. A., Hamburger, M. W., Allstadt, K., Wald, D. J., Robeson, S. M., Tanyas, H., Hearne, M., and Thompson, E. M.: A global empirical model for near-real-time assessment of seismicallyinduced landslides, J. Geophys. Res.-Earth, 123, 1835–1859, https://doi.org/10.1029/2017JF004494, 2019.
Nowicki, M. A., Wald, D. J., Hamburger, M. W., Hearne, M., and Thompson, E. M.: Development of a globally applicable model for near real-time prediction of seismically induced landslides, Eng. Geol., 173, 54–65, https://doi.org/10.1016/j.enggeo.2014.02.002, 2014.
Osna, T., Sezer, E. A., and Akgun, A.: GeoFIS: An integrated tool for the assessment of landslide susceptibility, Comput. Geosci., 66, 20–30, https://doi.org/10.1016/j.cageo.2013.12.016, 2014.
Polat, A.: An innovative, fast method for landslide susceptibility mapping using GIS-based LSAT toolbox, Environ. Earth Sci., 80, 217, https://doi.org/10.1007/s12665-021-09511-y, 2021.
Pradhan, B. and Saro, L.: Landslide susceptibility assessment and factor effect analysis: backpropagation artificial neural networks and their comparison with frequency ratio and bivariate logistic regression modelling, Environ. Modell. Softw., 25, 747–759, https://doi.org/10.1016/j.envsoft.2009.10.016, 2010.
Reichenbach, P., Rossi, M., Malamud, B. D., Mihir, M., and Guzzetti, F.: A review of statistically-based landslide susceptibility models, Earth-Sci. Rev., 180, 60–91, https://doi.org/10.1016/j.earscirev.2018.03.001, 2018.
Ren, J., Xu, X., Lv, Y., Wang, Q., Li, A., Li, K., Zhu, J., Cai, J., and Liu, S.: Late Quaternary slip rate of the northern Lancangjiang fault zone in eastern Tibet: Seismic hazards for the Sichuan-Tibet Railway and regional tectonic implications, Eng. Geol., 306, 106748, https://doi.org/10.1016/j.enggeo.2022.106748, 2022.
Roback, K., Clark, M. K., West, A. J., Zekkos, D., Li, G., Gallen, S. F., Chamlagain, D., and Godt, J. W.: The size, distribution, and mobility of landslides caused by the 2015 Mw7.8 Gorkha earthquake, Nepal, Geomorphology, 301, 121–138, https://doi.org/10.1016/j.geomorph.2017.01.030, 2018.
Robinson, T. R., Rosser, N. J., Densmore, A. L., Williams, J. G., Kincey, M. E., Benjamin, J., and Bell, H. J. A.: Rapid post-earthquake modelling of coseismic landslide intensity and distribution for emergency response decision support, Nat. Hazards Earth Syst. Sci., 17, 1521–1540, https://doi.org/10.5194/nhess-17-1521-2017, 2017.
Rossi, M. and Reichenbach, P.: LAND-SE: a software for statistically based landslide susceptibility zonation, version 1.0, Geosci. Model Dev., 9, 3533–3543, https://doi.org/10.5194/gmd-9-3533-2016, 2016.
Shao, X. and Xu, C.: Earthquake-induced landslides susceptibility assessment: A review of the state-of-the-art, Natural Hazards Research, 2 172–182, https://doi.org/10.1016/j.nhres.2022.03.002, 2022.
Shao, X., Ma, S., Xu, C., and Xu, X.: Effects of raster resolution on real probability of landslides, Remote Sens. Appl., 19, 100364, https://doi.org/10.1016/j.rsase.2020.100364, 2020a.
Shao, X., Ma, S., Xu, C., and Zhou, Q.: Effects of sampling intensity and non-slide/slide sample ratio on the occurrence probability of coseismic landslides, Geomorphology, 363, 107222, https://doi.org/10.1016/j.geomorph.2020.107222, 2020b.
Sun, J., Yue, H., Shen, Z., Fang, L., Zhan, Y., and Sun, X.: The 2017 Jiuzhaigou Earthquake: A Complicated Event Occurred in a Young Fault System, Geophys. Res. Lett., 45, 2230–2240, https://doi.org/10.1002/2017GL076421, 2018.
Swets, J. A.: Measuring the accuracy of diagnostic systems, Science, 240, 1285–1293, https://doi.org/10.1126/science.3287615, 1988.
Tanyas, H., Rossi, M., Alvioli, M., van Westen, C. J., and Marchesini, I.: A global slope unit-based method for the near real-time prediction of earthquake-induced landslides, Geomorphology, 327, 126–146, https://doi.org/10.1016/j.geomorph.2018.10.022, 2019.
Tapponnier, P., Zhiqin, X., Roger, F., Meyer, B., Arnaud, N., Wittlinger, G., and Jingsui, Y.: Oblique stepwise rise and growth of the Tibet plateau, Science, 294, 1671–1677, https://doi.org/10.1126/science.105978, 2001.
Tateishi, R.: Production of global land cover data-GLCNMO, Int. J. Digit. Earth, 4, 22–49, https://doi.org/10.1080/17538941003777521, 2010.
Tian, Y., Xu, C., Xu, X., and Chen, J.: Detailed inventory mapping and spatial analyses to landslides induced by the 2013 Ms 6.6 Minxian earthquake of China, J. Earth Sci., 27, 1016–1026, 2016.
Tian, Y., Xu, C., Ma, S., Xu, X., Wang, S., and Zhang, H.: Inventory and Spatial Distribution of Landslides Triggered by the 8th August 2017 MW 6.5 Jiuzhaigou Earthquake, China, J. Earth Sci., 30, 206–217, https://doi.org/10.1007/s12583-018-0869-2, 2019.
Tian, Y., Owen, L. A., Xu, C., Ma, S., Li, K., Xu, X., Figueiredo, P. M., Kang, W., Guo, P., Wang, S., Liang, X., and Maharjan, S. B.: Landslide development within 3 years after the 2015 Mw 7.8 Gorkha earthquake, Nepal, Landslides, 17, 1251–1267, https://doi.org/10.1007/s10346-020-01366-x, 2020.
Tolles, J. and Meurer, W. J.: Logistic Regression: Relating Patient Characteristics to Outcomes, Jama-J. Am. Med. Assoc., 316, 533–534, https://doi.org/10.1001/jama.2016.7653, 2016.
Torizin, J., Schüßler, N., and Fuchs, M.: Landslide Susceptibility Assessment Tools v1.0.0b – Project Manager Suite: a new modular toolkit for landslide susceptibility assessment, Geosci. Model Dev., 15, 2791–2812, https://doi.org/10.5194/gmd-15-2791-2022, 2022.
Umar, Z., Pradhan, B., Ahmad, A., Jebur, M. N., and Tehrany, M. S.: Earthquake induced landslide susceptibility mapping using an integrated ensemble frequency ratio and logistic regression models in West Sumatera Province, Indonesia, Catena, 118, 124–135, https://doi.org/10.1016/j.catena.2014.02.005, 2014.
U.S. Geological Survey (USGS): An Open Repository of Earthquake-Triggered Ground-Failure Inventories, https://www.sciencebase.gov/catalog/item/586d824ce4b0f5ce109fc9a6 (last access: 4 August 2022), 2017.
Wang, Y., Song, C., Lin, Q., and Li, J.: Occurrence probability assessment of earthquake-triggered landslides with Newmark displacement values and logistic regression: The Wenchuan earthquake, China, Geomorphology, 258, 108–119, https://doi.org/10.1016/j.geomorph.2016.01.004, 2016.
Wu, W., Xu, C., Wang, X., Tian, Y., and Deng, F.: Landslides Triggered by the 3 August 2014 Ludian (China) Mw 6.2 Earthquake: An Updated Inventory and Analysis of Their Spatial Distribution, J. Earth Sci., 31, 853–866, https://doi.org/10.1007/s12583-020-1297-7, 2020.
Xu, C. and Xu, X.: Statistical analysis of landslides caused by the Mw 6.9 Yushu, China, earthquake of April 14, 2010, Nat. Hazards, 72, 871–893, https://doi.org/10.1007/s11069-014-1038-2, 2014.
Xu, C., Dai, F., Xu, X., and Yuan, H. L.: GIS-based support vector machine modeling of earthquake-triggered landslide susceptibility in the Jianjiang River watershed, China, Geomorphology, 145–146, 70–80, https://doi.org/10.1016/j.geomorph.2011.12.040, 2012.
Xu, C., Xu, X., Zheng, W., Wei, Z., Tan, X., Han, Z., Li, C., Liang, M., Li, Z., and Wang, H.: landslides triggered by the April 20, 2013 Lushan, Sichuan province Ms 7.0 strong erathquake of China, Seismological Geology, 35, 641–660, 2013 (in Chinese).
Xu, C., Xu, X., Yao, X., and Dai, F.: Three (nearly) complete inventories of landslides triggered by the May 12, 2008 Wenchuan Mw 7.9 earthquake of China and their spatial distribution statistical analysis, Landslides, 11, 441–461, https://doi.org/10.1007/s10346-013-0404-6, 2014a.
Xu, C., Xu, X., Shyu, J. B. H., Zheng, W., and Min, W.: Landslides triggered by the 22 July 2013 Minxian–Zhangxian, China, Mw 5.9 earthquake: Inventory compiling and spatial distribution analysis, J. Asian Earth Sci., 92, 125–142, https://doi.org/10.1016/j.jseaes.2014.06.014, 2014b.
Xu, C., Xu, X., and Shyu, J. B. H.: Database and spatial distribution of landslides triggered by the Lushan, China Mw 6.6 earthquake of 20 April 2013, Geomorphology, 248, 77–92, https://doi.org/10.1016/j.geomorph.2015.07.002, 2015.
Xu, C., Xu, X., Zhou, B., and Shen, L.: Probability of coseismic landslides: A new generation of earthquake-triggered landslide hazard model, Journal of Engineering Geology, 27, 1122, https://doi.org/10.13544/j.cnki.jeg.2019084, 2019 (in Chinese).
Xu, X., Zhang, P., Wen, X., Qin, Z., Chen, G., and Zhu, A.: Features of active tectonics and recurrence behaviors of strong earthquakes in the western Sichuan province and its adjacent regions, Sesimology and Geology, 27, 446, https://doi.org/10.1103/PhysRevB.73.104437, 2005 (in Chinese).
Xu, X., Han, Z., and Yang, X.: Seismotectonic map in China and its adjacent regions, Seismological Press, Beijing, https://doi.org/10.1016/j.rse.2007.11.004, 2016 (in Chinese).
Xu, X. W., Wen, X. Z., Yu, G. H., Chen, G. H., Klinger, Y., Hubbard, J., and Shaw, J.: Coseismic reverse- and oblique-slip surface faulting generated by the 2008 Mw 7.9 Wenchuan earthquake, China, Geology, 37, 515–518, https://doi.org/10.1130/G25462A.1, 2009.
Yao, X., Tham, L. G., and Dai, F. C.: Landslide susceptibility mapping based on Support Vector Machine: A case study on natural slopes of Hong Kong, China, Geomorphology, 101, 572–582, https://doi.org/10.1016/j.geomorph.2008.02.011, 2008.
Zhang, P., Deng, Q., Zhang, G., Ma, J., Gan, W., Min, W., Mao, F., and Wang, Q.: Active tectonic blocks and strong earthquakes in the continent of China, Sci. China Ser. D., 46, 13–24, https://doi.org/10.1360/03dz0002, 2003.
Zhao, B., Zhao, X., Zeng, L., Wang, S., and Du, Y.: The mechanisms of complex morphological features of a prehistorical landslide on the eastern margin of the Qinghai-Tibetan Plateau, B. Eng. Geol. Environ., 80, 3423–3437, https://doi.org/10.1007/s10064-021-02114-8, 2021.
Zheng, W., Yuan, D., He, W., Min, W., Ren, Z., Liu, X., Wang, A., Xu, C., Ge, W., and Li, F.: Geometric pattern and active tectonics in Southeastern Gansu province: Discussion on seismogenic mechanism of the Minxian-Zhangxian M(S)6. 6 earthquake on July 22, 2013, Chinese J. Geophys., 56, 4058–4071, https://doi.org/10.6038/cjg20131211, 2013.
Zhuang, J., Peng, J., Zhu, X., and Huang, W.: Scenario-Based Risk Assessment of Earthquake Disaster Using Slope Displacement, PGA, and Population Density in the Guyuan Region, China, ISPRS Int. J. Geo-Inf., 8, 85, https://doi.org/10.3390/ijgi8020085, 2019.