INSTALLATION OF MRTG IN UBUNTU AND MONITOR LINUX DISK MEMORY AND PING GRAPHS
[Advance Monitoring]
~!~ Article By Syed Jahanzaib ~!~


The Multi Router Traffic Grapher (MRTG) is a tool to monitor the traffic load on network links. MRTG generates HTML pages containing PNG images which provide a LIVE visual representation of this traffic.MRTG is not limited to monitoring traffic, though. It is possible to monitor any SNMP variable you choose. You can even use an external program to gather the data which should be monitored via MRTG. People are using MRTG, to monitor things such as System Load, Login Sessions, and about anything . MRTG even allows you to accumulate two or more data sources into a single graph. I have used MRTG to monitor everything on my network, whether its a switch, router, ports, isa server counters, windows counters, linux counters, harddrive space monitoring, etc etc.
I HAVE PASTED THE SAMPLE WORKING CFG FILES AT THE END. JUST FOR REFERENCE.
Now we will move on to howto install MRTG. If you have Freshly installed UBUNTU , You need to install Web Server (apache2)
apt-get install apache2
Now we will install MRTG
apt-get install mrtg
(Choose Yes to continue)
Now we will install SNMP Server and other SNMP utilities so that web can collect information for localhost and remote pcs via snmp.
apt-get install snmp snmpd
Now set your community string in /etc/snmp/snmpd.conf , Remove all Lines and add the following line only.
nano /etc/snmp/snmpd.conf
rocommunity public
syslocation "Karachi NOC, Paksitan"
syscontact  aacable@hotmail.com
Save and exit.
now edit /etc/default/snmpd
nano /etc/default/snmpd
and change following
# snmpd options (use syslog, close stdin/out/err).
SNMPDOPTS='-Lsd -Lf /dev/null -u snmp -I -smux -p /var/run/snmpd.pid'
To THIS:
# snmpd options (use syslog, close stdin/out/err).
# SNMPDOPTS='-Lsd -Lf /dev/null -u snmp -I -smux -p /var/run/snmpd.pid '
SNMPDOPTS='-Lsd -Lf /dev/null -u snmp -I -smux -p /var/run/snmpd.pid -c /etc/snmp/snmpd.conf'
and restart snmpd
/etc/init.d/snmpd restart
OR
service snmpd restart
If you want to have MIBS, use following
Now download MIBs (which will be used to query counters by name)
sudo apt-get install snmp-mibs-downloader
Copy all mibs in any single folder like /cfg/mibs/
mkdir /cfg
mkdir /cfg/mibs
cp /var/lib/mibs/ietf/* /cfg/mibs
NOTE: Make sure you remove .txt or add .txt in every mib , and use the name in mrtg.cfg accordingly. This is required if you want to use names instead of numeric values 😀
This was the issue for which I was stuck for many hours 😦
E.g:
#LoadMIBs: /cfg/mibs/UCD-SNMP-MIBOR following if files are in .txt, then use following
#LoadMIBs: /cfg/mibs/HOST-RESOURCES-MIB.txt
↓
Testing SNMP Service for localhost.
Now snmp service have been installed, its better to do a snmpwalk test from localhost or another remote host to verify our new configuration is responding correctly. issue the following command from localhost terminal.
snmpwalk -v 1 -c public 127.0.0.1
and you will see lot of oids and information which confirms that snmp service is installed and responding OK.
Adding MRTG to crontab to run after very 5 minutes
If already not added in /etc/cron.d/ folder, then you can add it manually in crontab
crontab -e
(if it asks for preferred text editor, go with nano, its much easier)
now add following line (Make sure to adjust /etc/mrtg.cfg location,
*/5 * * * * env LANG=C mrtg /etc/mrtg.cfg --logging /var/log/mrtg.log
Some tips for INDEX MAKER and running MRTG manually …
Following is the command to create CFG file for remote pc.
cfgmaker public@192.168.100.1 > test.cfg
Following is the command to check remote pc snmp info
snmpwalk -v 1 -c public 192.168.100.1
Following is the command to create index page for your cfg file.
indexmaker /etc/mrtg.cfg -output /var/www/mrtg/index.html -columns=2
Following is the command to run MRTG to create your graph file.
env LANG=C mrtg /etc/mrtg.cfg
MIKROTIK WORKING CFG EXAMPLES FOR MRTG , JUST FOR REFERENCE
You can create graphs for about any thing you like. Its really powerful and I always prefer MRTG over other easy applications like CACTI or others. You can modify it as you like.
I will add more MRTG details on howto monitor linux / Microsoft / MIKROTIK soon.
MRTG WORKING CFG EXAMPLES, JUST FOR REFERENCE
#########################
# START OF /etc/mrtg.cfg#
#########################
# AUthor: Syed Jahanzaib
# Email : aacable@hotmail.com
# Web : https://aacable.wordpress.com

WorkDir:/var/www/mrtg
Options[_]: growright,nobanner,logscale,pngdate,bits
Options[^]: growright,nobanner,logscale,pngdate,bits
XSize[_]: 600
YSize[_]: 200
EnableIPv6: no
RunAsDaemon: no
Interval: 5
#Logformat: rrdtool
#Use MIBS as per your local config
LoadMIBs: /cfg/mibs/HOST-RESOURCES-MIB /cfg/mibs/IF-MIB /cfg/mibs/UCD-SNMP-MIB
PageFoot[^]: Page managed by SYED JAHANZAIB
AddHead[_]:
Background[_]: #F6F1EE

# Change it as required , it means mrtg will read following file and will create graphs based on its contents

Include: /cfg/lanwan.cfg
Include: /cfg/mt.cfg
Include: /cfg/radius.cfg
Include: /cfg/ping.cfg
Include: /cfg/vlan.cfg

#########################
# END OF /etc/mrtg.cfg #
#########################
Following cfg will query memory and disk space by MIB name, its easier to query via mib name, rather then long OID number.
to get the last number of OID (which nee to be replace for almost every different system, use following command)
To get DISK LAST OID number
snmpwalk -v1 -c public 192.168.100.1 -m /cfg/mibs/HOST-RESOURCES-MIB |grep hrStorageDescr

HOST-RESOURCES-MIB::hrStorageDescr.1 = STRING: Physical memory
HOST-RESOURCES-MIB::hrStorageDescr.3 = STRING: Virtual memory
HOST-RESOURCES-MIB::hrStorageDescr.6 = STRING: Memory buffers
HOST-RESOURCES-MIB::hrStorageDescr.7 = STRING: Cached memory
HOST-RESOURCES-MIB::hrStorageDescr.8 = STRING: Shared memory
HOST-RESOURCES-MIB::hrStorageDescr.10 = STRING: Swap space
HOST-RESOURCES-MIB::hrStorageDescr.31 = STRING: /
HOST-RESOURCES-MIB::hrStorageDescr.32 = STRING: /sys/fs/fuse/connections
HOST-RESOURCES-MIB::hrStorageDescr.33 = STRING: /dev
HOST-RESOURCES-MIB::hrSWRunParameters.29273 = STRING: "--color=auto hrStorageDescr"
root@ubuntu:/cfg#
Now look for / , which have hrStorageDescr.31 , so the disk oid we need to query is .31
and for memory use following
snmpwalk -v1 -c gt 192.168.100.1 -m /cfg/mibs/HOST-RESOURCES-MIB |grep memory

# and you will get following results...

HOST-RESOURCES-MIB::hrStorageDescr.1 = STRING: Physical memory
as can see .1 is the memory index key that you need to use in thw following
# Start of other CFG files
# disk space monitoring for / partition. you can query it via snmpwalk Target[linux_server]: ( hrStorageUsed.31&hrStorageUsed.31:public@192.168.100.1 ) * 100 / ( hrStorageSize.31&hrStorageSize.31:public@192.168.100.1 ) Title[linux_server]: Disk usage for Radius Manager Linux Server PageTop[linux_server]: <H1> Disk usage for Radius Manager Linux Server </H1> MaxBytes[linux_server]: 100 ShortLegend[linux_server]: % YLegend[linux_server]: % of RM_DISK Legend1[linux_server]: Used RM_DISK LegendI[linux_server]: Used : LegendO[linux_server]: Options[linux_server]: nopercent, gauge, integer Unscaled[linux_server]: ymwd #Percent of memory used Target[radius_server_mem_ram]: ( hrStorageUsed.1&hrStorageUsed.1:public@192.168.100.1) * 100 / ( hrStorageSize.1&hrStorageSize.1:public@192.168.100.1) Title[radius_server_mem_ram]: Memory usage for Radius Server PageTop[radius_server_mem_ram]: <H1> Memory usage for Radius Server </H1> MaxBytes[radius_server_mem_ram]: 100 ShortLegend[radius_server_mem_ram]: % YLegend[radius_server_mem_ram]: % of Memory Legend1[radius_server_mem_ram]: Used Memory LegendI[radius_server_mem_ram]: Used : LegendO[radius_server_mem_ram]: Options[radius_server_mem_ram]: nopercent, gauge, integer, growright Unscaled[radius_server_mem_ram]: ymwd
PING GRAPHS SCRIPTS
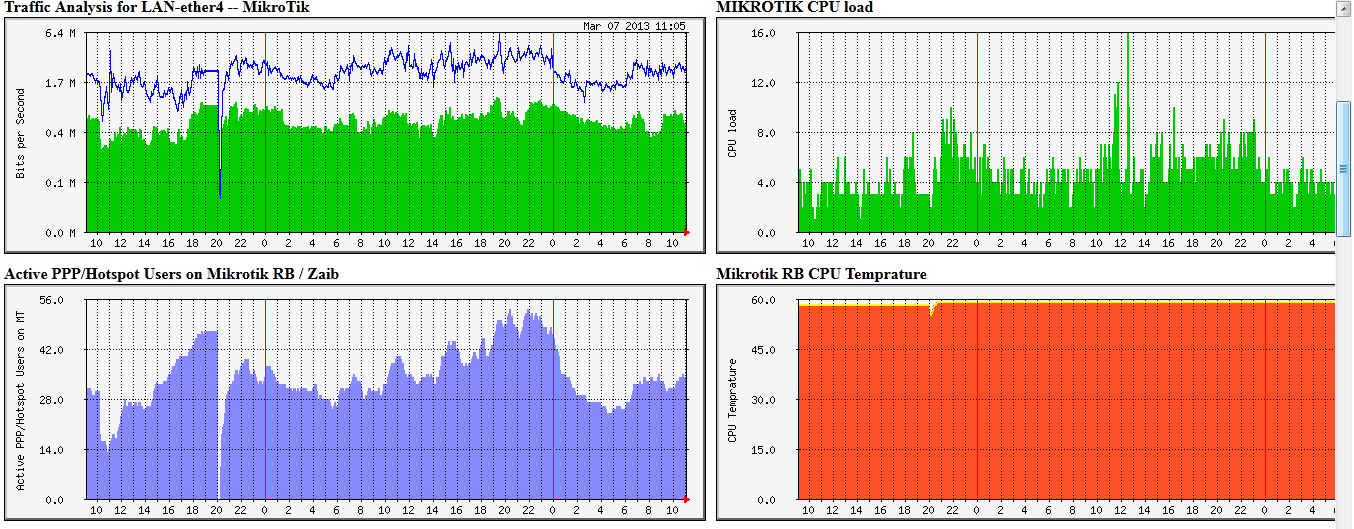
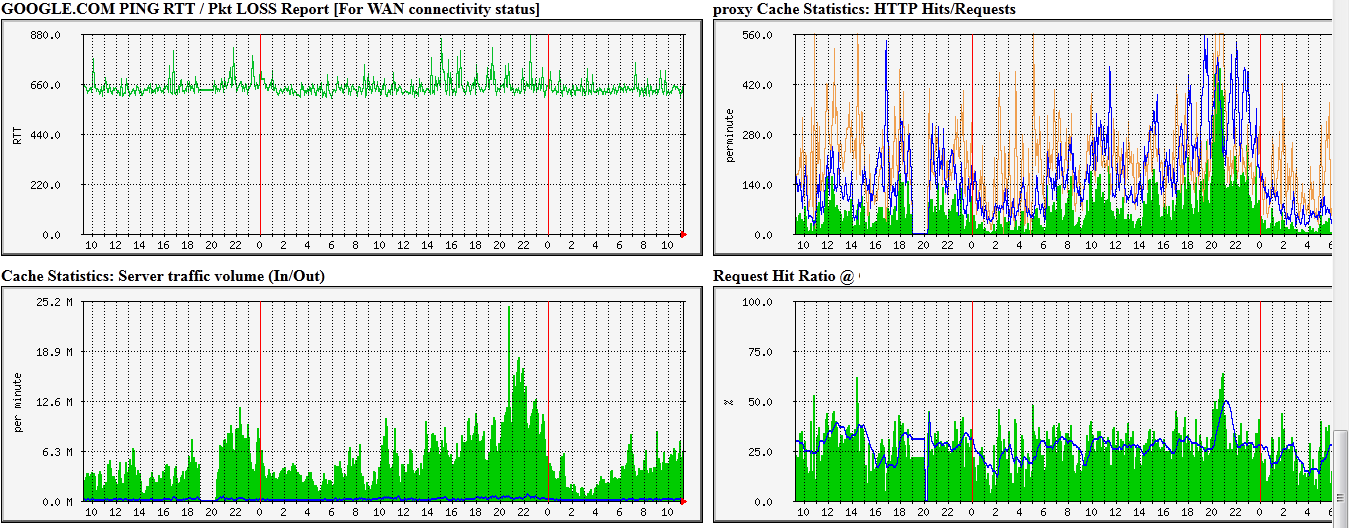
### ping.cfg
# 192.168.100.2 MIKROTIK NAS SERVERPING GRAPH
Title[mikrotik.ping]: MIKROTIK NAS SERVER PING RTT / Pkt LOSS Report
PageTop[mikrotik.ping]: <H1>MIKROTIK NAS SERVER PING RTT / Pkt LOSS Report</H1>
Target[mikrotik.ping]: `/cfg/norping.sh 192.168.100.2`
Colours[mikrotik.ping]: R#f75712,G#04bf27,G#70ff53,R#70ff53
MaxBytes[mikrotik.ping]: 100
AbsMax[mikrotik.ping]: 100
Options[mikrotik.ping]: growright,nopercent,gauge
LegendI[mikrotik.ping]: Pkt LOSS
LegendO[mikrotik.ping]: Active Round Trip Time
YLegend[mikrotik.ping]: RTT
Legend1[mikrotik.ping]: Pkt LOSS
Legend2[mikrotik.ping]: Active RTT

# Google PING GRAPH
Title[google.ping]: GOOGLE.COM PING RTT / Pkt LOSS Report
PageTop[google.ping]: <H1>GOOGLE.COM PING RTT / Pkt LOSS Report</H1>
Target[google.ping]: `/cfg/norping.sh google.com`
Colours[google.ping]: R#f75712,G#04bf27,G#70ff53,R#70ff53
MaxBytes[google.ping]: 1000
AbsMax[google.ping]: 1000
Options[google.ping]: growright,nopercent,gauge
LegendI[google.ping]: Pkt LOSS
LegendO[google.ping]: Active Round Trip Time
YLegend[google.ping]: RTT
Legend1[google.ping]: Pkt LOSS
Legend2[google.ping]: Active RTT

### ping.cfg
# 192.168.100.10 GT MAIN SWITCH PING GRAPH
Title[gtsw-core.ping]: GT CORE SWITCH PING GRAPH PING RTT / Pkt LOSS Report
PageTop[gtsw-core.ping]: <H1>GT CORE SWITCH PING RTT / Pkt LOSS Report</H1>
Target[gtsw-core.ping]: `/cfg/norping.sh 192.168.100.10`
Colours[gtsw-core.ping]: R#f75712,G#04bf27,G#70ff53,R#70ff53
MaxBytes[gtsw-core.ping]: 100
AbsMax[gtsw-core.ping]: 100
Options[gtsw-core.ping]: growright,nopercent,gauge
LegendI[gtsw-core.ping]: Pkt LOSS
LegendO[gtsw-core.ping]: Active Round Trip Time
YLegend[gtsw-core.ping]: RTT
Legend1[gtsw-core.ping]: Pkt LOSS
Legend2[gtsw-core.ping]: Active RTT
scripts for ping
norping.cfg (for normal ping for wan)
#!/bin/bash
HOST=$1
ping -c 3 $HOST > /dev/null
DATA=`ping -c 3 $1 -q `
if [ $? -eq 0 ]
then
echo "0"
echo $DATA | awk -F/ '{print $6 }'
else
echo "100
0"
fi
MYSQL Database size monitoring in MRTG using bash script
1# Bash file to output DB Size for mysql hosted locally on same server.
#!/bin/bash
# Script to query mysql stats
#set -x
HOST="127.0.0.1"
USER="root"
PASS="MYSQLPASS"
DB="radius"
CMD=`mysql -u$USER -pMYSQLPASS --skip-column-names -e "SELECT table_schema "radius", sum(data_length + index_length) FROM information_schema.TABLES WHERE table_schema='radius' GROUP BY table_schema;"`
F=`echo $CMD | cut -f1 -d"." | sed 's/[^0-9]*//g'`
echo $F
echo $F
2# Bash file to output DB Size for mysql hosted locally on REMOTE server using SSH key method.
#!/bin/bash
# Script to query mysql stats
#set -x
HOST="192.168.0.1"
USER="root"
PASS="PASS"
DB="radius"
PORT="55511"
CMD=`ssh -p $PORT $HOST mysql -uroot '-pMYSQLPASS' --skip-column-names -e '"SELECT' table_schema '"radius",' 'sum(data_length' + 'index_length)' FROM information_schema.TABLES WHERE 'table_schema='\''radius'\''' GROUP BY 'table_schema;"' | cut -f1 -d"." | sed 's/[^0-9]*//g'`
echo $CMD
echo $CMD
CFG Example:
Title[0.1_radius_db_size]: 192.168.0.1 - MYSQL RADIUS DB SIZE
Target[0.1_radius_db_size]: `/temp/qmysql.0.1.sh`
PageTop[0.1_radius_db_size]:
<h1>192.168.0.1 - MYSQL RADIUS DB SIZE</h1>
Kilo[0.1_radius_db_size]: 1024
MaxBytes[0.1_radius_db_size]: 10737418240
ShortLegend[0.1_radius_db_size]: B
YLegend[0.1_radius_db_size]: MB-or-GB
Legend1[0.1_radius_db_size]: Used
#Legend2[0.1_radius_db_size]: Total
LegendI[0.1_radius_db_size]: Used:
LegendO[0.1_radius_db_size]: Used:
Options[0.1_radius_db_size]: gauge,growright,nobanner,nopercent,integer,transparent,noo
Graph Example:


i want install squid server for caching and natting. i have fiber optic link from ISP with the /27 live IPS. i will assign one live ip to WAN interface of my linux. how i can use the other live IP for my clients after nat configure or filter by linux squid server.
i really confused with this.
i have also ASA firewall can i use and other cisco products like routers or cisco. please give me a solution that i can use linux as a cache server and ASA as firewall server. i already configured it is working with private IP address. but i don’t know what to do that that some my clients want live IP from me. i can assign to them but it is not working. ISP provide me /27 live IP subnet to distribute it for you clients who demand for live IP but i dont know what to do that i distribute it to clients. how i will configure this in ASA FIREWALL and SQUID server.
LikeLike
Comment by AliAkbar Sakhi — October 6, 2012 @ 2:26 PM